The Chart That Proves That The Mainstream Media Is Lying To You About Unemployment

By Michael, on March 10th, 2013
www.TheEconomicCollapseBlog.com
The mainstream media is absolutely giddy that the U.S. unemployment rate has hit a “four-year low” of 7.7 percent. But is unemployment in the United States actually going down? After all, you would think that it should be. The Obama administration has “borrowed” more than 6 trillion dollars from future generations of Americans, interest rates have been pushed to all-time lows, and the Federal Reserve has been wildly printing more money in a desperate attempt to “stimulate” the economy. So have those efforts been successful? Well, according to the mainstream media, the U.S. unemployment rate is falling steadily. Headlines all over the nation boldly declared that “236,000 jobs” were added to the economy in February, but what they didn’t tell you was that the number of Americans “not in the labor force” rose by 296,000. And that is how they are getting the unemployment rate to go down – by pretending that huge numbers of unemployed Americans don’t want jobs. Sadly, as you will see below, the truth is that the percentage of working age Americans that have a job is just 0.1% higher than it was exactly three years ago. And we have not even come close to getting back to where we were before the last economic crisis. For example,
more than 146 million Americans were employed back in 2007. But today, only
142.2 million Americans have a job even though our population has grown steadily since then. So where in the world is this “economic recovery” that they keep talking about?
At this point, the “unemployment rate” has become so meaningless that it really isn’t even worth paying much attention to. If you really want to know what the employment picture looks like in the United States, you need to look at the employment-population ratio.
As
Wikipedia tells us, many economists consider the employment-population ratio to be far superior to other measurements of employment…
The
Organization for Economic Co-operation and Development defines the
employment rate as the
employment-to-population ratio. The employment-population ratio is many American economist’s favorite gauge of the American jobs picture. According to Paul Ashworth, chief North American economist for Capital Economics, “The employment population ratio is the best measure of labor market conditions.” This is a statistical
ratiothat measures the proportion of the country’s working-age population (ages 15 to 64 in most OECD countries) that is employed. This includes people that have stopped looking for work.
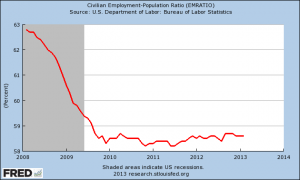
A chart of the employment-population ratio in the United States over the past several years is posted below…
Yes, we should be thankful that things have stabilized, but as you can see
there has been no recovery. The percentage of Americans with a job is essentially exactly where it was three years ago. Despite the trillions of dollars that the U.S. government has borrowed, and despite the reckless
money printing that the
Federal Reserve has been doing, the employment situation in the U.S. has not turned around.
2008-01-01 62.9
2008-02-01 62.8
2008-03-01 62.7
2008-04-01 62.7
2008-05-01 62.5
2008-06-01 62.4
2008-07-01 62.2
2008-08-01 62.0
2008-09-01 61.9
2008-10-01 61.7
2008-11-01 61.4
2008-12-01 61.0
2009-01-01 60.6
2009-02-01 60.3
2009-03-01 59.9
2009-04-01 59.8
2009-05-01 59.6
2009-06-01 59.4
2009-07-01 59.3
2009-08-01 59.1
2009-09-01 58.7
2009-10-01 58.5
2009-11-01 58.6
2009-12-01 58.3
2010-01-01 58.5
2010-02-01 58.5
2010-03-01 58.5
2010-04-01 58.7
2010-05-01 58.6
2010-06-01 58.5
2010-07-01 58.5
2010-08-01 58.5
2010-09-01 58.5
2010-10-01 58.3
2010-11-01 58.2
2010-12-01 58.3
2011-01-01 58.3
2011-02-01 58.4
2011-03-01 58.4
2011-04-01 58.4
2011-05-01 58.4
2011-06-01 58.2
2011-07-01 58.2
2011-08-01 58.3
2011-09-01 58.4
2011-10-01 58.4
2011-11-01 58.5
2011-12-01 58.6
2012-01-01 58.5
2012-02-01 58.6
2012-03-01 58.5
2012-04-01 58.5
2012-05-01 58.6
2012-06-01 58.6
2012-07-01 58.5
2012-08-01 58.4
2012-09-01 58.7
2012-10-01 58.7
2012-11-01 58.7
2012-12-01 58.6
2013-01-01 58.6
2013-02-01 58.6
So is there anyone out there that still wants to insist that the employment picture in the United States is getting significantly better?
Anyone that wants to claim that “unemployment is going down” should at least wait until the unemployment-population ratio gets back up to 59 percent. Otherwise they just look foolish.
Most Americans understand that the Dow has been pumped up with all of the funny money that the Fed has beenshows-1-in-2-peopl_1_n_1150128.html” style=”background-color: inherit; color: #286ea0; font-weight: bold; margin: 0px; padding: 0px; text-decoration: none;” target=”_blank” title=”more than 146 million Americans”>moreif; line-height: 19.453125px; margin-bottom: 16px; padding: 0px;”>
Just consider these numbers…
-The number of homeless people sleeping in homeless shelters in New York City has increased
by 19 percent over the past year.
-The number of Americans on food stamps has risen from 32 million to 47 million while Barack Obama has been in the White House.
No, the truth is that everything is most definitely not fine.
Back in 2008, a
derivatives crisis was one of the primary causes of the worst financial panic since the Great Depression.
So did we learn our lesson?
No, the boys on Wall Street are back at it again as a recent article
by Jim Armitage described…
Historically, stock markets, being driven by humans, have tended to have a similar length memory of catastrophes, before making the same dumb mistakes again.
But it hasn’t even been five years since derivatives (on that occasion based on daft mortgages) blew up the world, and yet these exotic creatures have already returned. With a vengeance.
Research from Thomson Reuters declared that banks were creating more derivatives known as asset-backed securities than at any time since before the Lehman Brothers crash. Of those, 22 percent were made up of – and forgive me the alphabet soup here – CDOs and CLOs. The very type of derivatives that exploded last time. At this stage last year, only 6 percent fell into those categories.
In other words, banks are creating more of the riskiest types of the riskiest products.
At some point, we will have another derivatives crisis even worse than the last one.
When that happens, financial markets all over the globe will crash, economic activity will grind to a standstill and unemployment will go skyrocketing once again.
But as you saw above, we have never even come close to recovering from the last crisis.
So you can believe the mind-numbing propaganda that the
mainstream media is trying to feed you if you want. Unfortunately, the reality of the matter is that we have not recovered from the last major economic crisis, and another one is
rapidly approaching.
I hope that you are getting ready.


 money printing