Warning!! The final indicator before the financial crash happened – a collapse like in 2001 – 2008 is imminent!!!
Wednesday, March 2, 2016 5:03
% of readers think this story is Fact. Add your two cents.

Full article at:
http://news-uncensored-fresh.blogspot.be/2016/03/warning-final-indicator-before.html
Since August of 2015, we’ve been following the decline in U.S. equities and marking the similarities to the previous market collapses of 2001 and 2008.
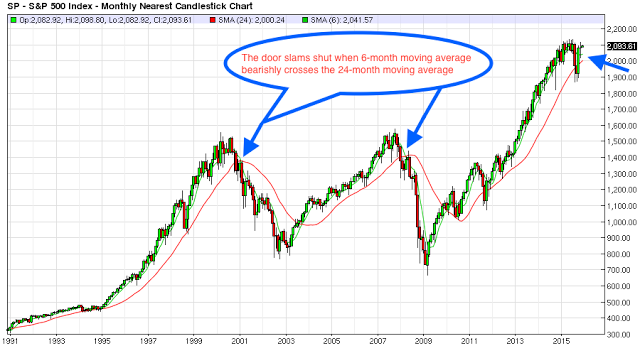
We’d suggested last autumn that there was one, final indicator that we needed to see before issuing a final warning.
Well, HERE YOU GO…
Since August of 2015, we’ve been following the decline in U.S. equities and marking the similarities to the previous market collapses of 2001 and 2008. We’d suggested last autumn that there was one, final indicator that we needed to see before issuing a final warning. Well, here you go.
Before proceeding, I urge you to review the link below. For proper context, it is extremely important that you do so:
And, again, this update comes with the same caveat/disclaimer that we’ve included in each of these posts since August:
All of this comes with an important caveat. Though there was certainly some Central Bank market manipulation in 2001 and 2008, it was NOTHING compared to what we see today. Will cycles and history be too much for the CBs to overcome? Instead, will their almost daily interventions be able to stem the tide? We’re about to find out.
Next, a copy-and-paste recap of the S&P action since August and the eerie similarities to 2001 and 2008:
————————————————————————————————————————————-
December 2000: Range was 9.72%. Final loss was 4.97%
January 2008: Range was 13.72%. Final loss was 6.38%
August 2015: Range was 11.64%. Final loss was 6.67%
Pretty startling similarities, wouldn’t you say?
We then projected an October-November rally based upon the Green Candles of Hope in 2001 and 2008. These previous Green Candle bounces produced the following gains:
Late December 2000 – January 2001: S&P rally from 1254 low to 1383 high. Total gain of 10.3%
March 2008 – May 2008: S&P rally from 1257 low to 1440 high. Total gain of 14.6%
Late September 2015 – November 2015: S&P rally from 1872 low to 2099 high. Total gain of 12.1%.
As you can see, the market action in late 2015 was eerily similar to what foreshadowed the massive bear markets of 2001 and 2008. So, do the similarities continue? See for yourself.
After the Green Candle of Hope is early 2001, the market’s bubble finally burst as the month of February 2001 saw a total S&P range of 11.7% with a final monthly loss of 9.2%.
After the Green Candle of Hope in the spring of 2008, the market’s bubble finally burst as the month of June 2008 saw a total S&P range of 9.4% with a final monthly loss of 8.6%.
After the Green Candles of Hope in late 2015, did the market’s bubble finally burst? The total S&P range in January was 11.1% and the total monthly loss was 4.8%. However, without the startling announcement of negative interest rates by the BoJ on Friday…spiking the USDJPY and taking the S&P futures with it…the total loss for January would have been 7.1%.
——————————————————————————————————————————————
We first published the chart below on 12/1/15. Please take a good look: