
| Online: | |
| Visits: | |
| Stories: |

| Story Views | |
| Now: | |
| Last Hour: | |
| Last 24 Hours: | |
| Total: | |
Tweet Lexicocalorimeter Reveals Eating and Exercising by State
It’s easy to find out how many calories are in a Twinkie. But how about in a tweet?
A team of scientists have invented a new instrument for measuring just that: the caloric content of social media posts–like tweets.
“This can be a powerful public health tool,” says Peter Dodds, a scientist at the University of Vermont, who co-led the invention of the new device–called a Lexicocalorimeter. “It’s a bit like having a satellite image of how people in a state or city are eating and exercising.”
COUNTING CALORIES
Of course, people don’t actually eat tweets. Instead, the Lexicocalorimeter gathers tens of millions of geo-tagged Twitter posts from across the country and fishes out thousands of food words — like “apples,” “ice cream,” and “green beans.” At the same time, it finds thousands of activity-related terms — like “watching TV,” “skiing,” and even “alligator hunting” and “pole dancing.” These giant bags of words get scored–based on data about typical calorie content of foods and activity burn rates — and then compiled into two measures: “caloric input” and “caloric output.”
The ratio of these two measures begins to paint a picture that might be of interest not just to athletes or weight-watchers, but also to mayors, public health officials, epidemiologists, or others interested in “public policy and collective self-awareness,” the team of scientists write in their new study.
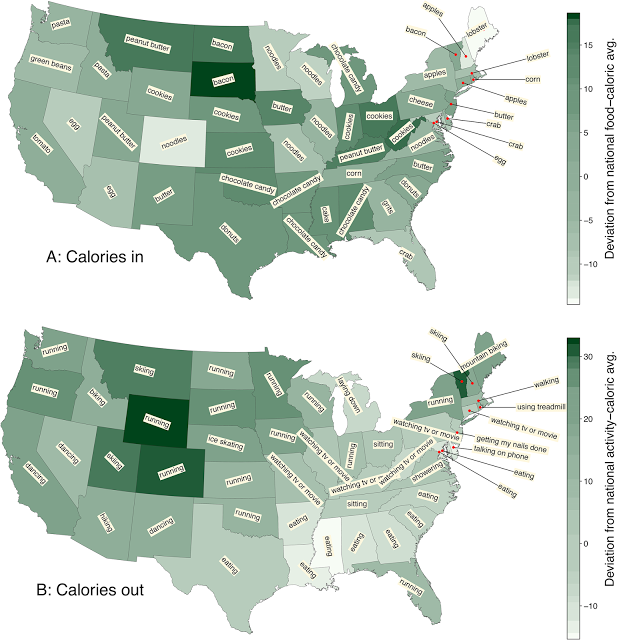
The Lexicocalorimeter is open for visits by the public (click here), and the current version gives a portrait of each of the contiguous US states. For example, the tweet flow into the device suggests that Vermont consumes more calories, per capita, than the overall average for the US. Why? Well, at the top of its list of words that push the Green Mountain State to the gourmand’s side of the ledger is “bacon” — tied for second in the US when states are ranked by bacon’s contribution to caloric balance. “We love to tweet about bacon,” says Chris Danforth, a UVM scientist and mathematician who co-led the new study.
But Vermont also expends more calories than average, the device indicates, thanks to relatively frequent appearances of the words “skiing,” “running,” “snowboarding,” and, yes, “sledding.” And why does the Lexicocalorimeter suggest that New Jersey expends fewer calories than the US average? Below-average on “running” while the top of its low-intensity activity list is “getting my nails done.”
Overall, Colorado ranks first in the US for its caloric balance (“noodles” plus “running” seem to be a svelte pair) while Mississippi comes in last with relatively high representation of “cake” and “eating.”
DASHBOARD FOR HEALTH
The new PLOS ONE study suggests that the Lexicocalorimeter could provide a new — and real-time — measure of the US population’s health. And the study shows that the device’s remotely sensed results correlate very closely with other traditional measures of US well-being, like obesity and diabetes rates. For the study, the team of scientists explored about 50 million geo-tagged tweets from 2011 and 2012 and report that “pizza” was the dominant contributor to the measure of “calories in” in nearly every state. The dominant contributor to calories out: “watching TV or movies.”
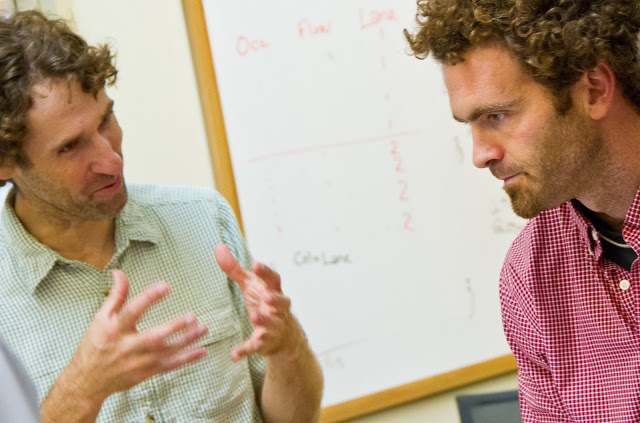
University of Vermont scientists Peter Dodds (left) and Chris Danforth are leading an effort to build a series of online instruments that can quantify health-related behaviors from social media. Their newest device is a called a Lexicocalorimeter.

Credit: Joshua Brown
The Lexicocalorimeter is part of a larger effort by the University of Vermont team to build a series of online instruments that can quantify health-related behaviors from social media. “Given the right tools, our mobile phones will very soon know more about us than we know about ourselves,” says UVM’s Chris Danforth. “While the Lexicocalorimeter is focused on eating and exercise, and the Hedonometer is measuring happiness, the methodology we’re building is far more general, and will eventually contribute to a dashboard of public health measures to complement traditional sources of data.”
The bigger goal: “enable real-time sensing at the population level, and help health care providers make date-driven recommendations for public policy,” says Danforth.
Other measures of public health and behavior the team is considering adding to the dashboard? “Sleep is a huge health issue,” says UVM’s Peter Dodds. “We would like to make an Insomniameter. Then there could be a Hangoverometer.”
Source:


