


| Story Views | |
| Now: | |
| Last Hour: | |
| Last 24 Hours: | |
| Total: | |
The S&P 500: Through the Loop!

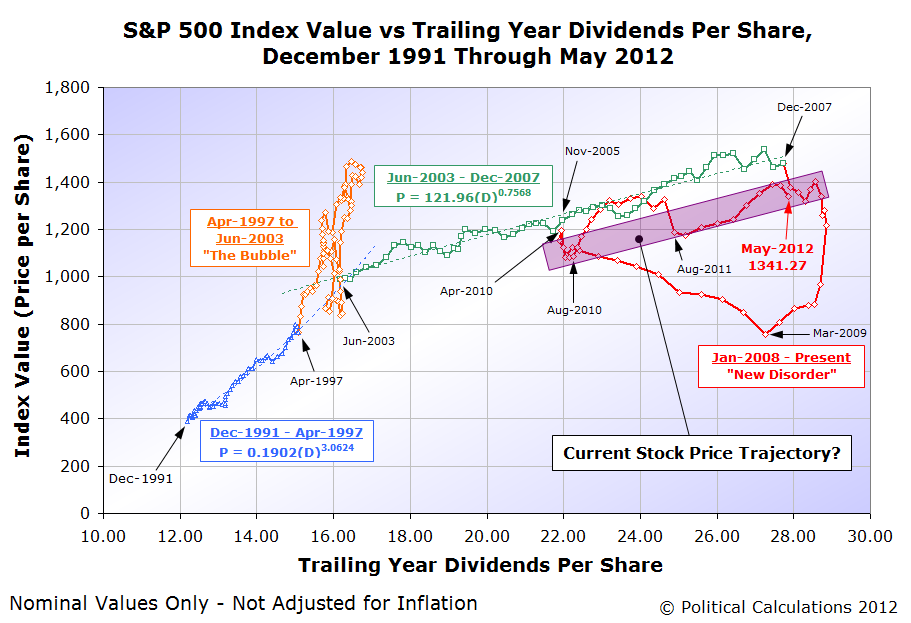
Back on 5 June 2012, we featured the following chart showing that the S&P 500 was, with respect to its dividends per share, about to “complete the loop” it began after December 2007:
Today, we’re updating our chart to reveal that the S&P 500 has made it through the loop!
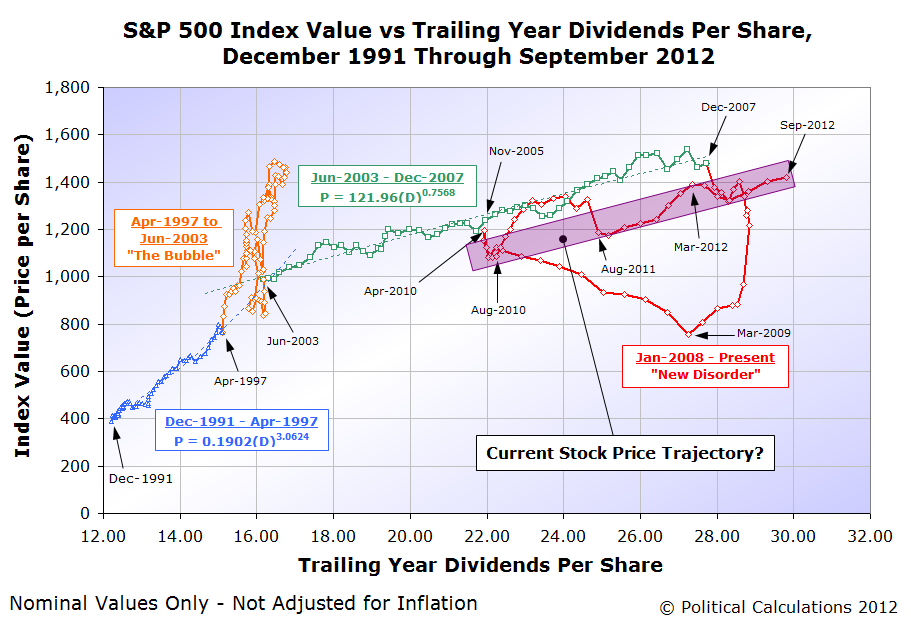
As you can see, aside from tweaking the horizontal axis to show the S&P 500′s trailing year dividends per share from $12 to $32 (instead of the range from $10 to $30), the biggest change we’ve made on our chart was to adjust the purple “trajectory zone” to extend further outward to accommodate the market’s higher stock prices and dividend per share values.
Now that the Fed seems to be committing to a new round of quantitative easing, aka “QE 3.0″, one thing we would look for based on the prior two rounds is for stock prices to shift upward with respect to their current trajectory, by about 10-15%.
That would put the trajectory of stock prices with respect to their underlying dividends per share roughly in line with their trajectory from June 2003 through December 2007, just as it did during QE 1.0 and QE 2.0.
However, that may be harder for the Fed to achieve this time around, given the ongoing fiscal crisis in Europe, which has sent government bond investors to U.S. Treasury auctions for their relative safety, and which in turn, has depressed the yields of U.S. treasuries. Those reduced yields leave less room for the Fed to lower long term interest rates, which would then limit the Fed’s ability to boost stock prices by the same percentages it was able to achieve in its earlier rounds of quantitative easing, given the relationship between long term interest rates and stock prices.
We would then expect that stock prices will be boosted in QE 3.0, but by less than the 10-15% increases achieved during QE 1.0 and QE 2.0.
Previously on Political Calculations
2012-09-11 05:01:26
Source: http://politicalcalculations.blogspot.com/2012/09/the-s-500-through-loop.html
Source:
