


| Story Views | |
| Now: | |
| Last Hour: | |
| Last 24 Hours: | |
| Total: | |
Aflac Inc. is rather stable in 2012Q4
Saturday, November 10, 2012 12:13
% of readers think this story is Fact. Add your two cents.

Here we revisit our stock price model for Aflac Incorporated (AFL). This model was first estimates in March 2011 and has been several times re-estimated with new data. Currently, we have the closing monthly price for October 2012 and the consumer price indices for September 2012. We decompose a share price into a weighted sum of two consumer price indices. This allows linking any share price with relative pricing power of goods and services associated with the company. Accordingly, our goal is to test the original model and to update time lags and coefficients. Overall, the model has demonstrated an excellent predictive power and stability over the whole period since 2011. It can predict at a two-month horizon and the current prediction foresees no significant changes in the AFL price in November-December 2012.
As in all previous models, the AFL share price is defined by the consumer price index of household furnishing and operations (HFO) and that transportation services (TS). In February 2012, the defining time lags were as follows: the HFO index led the share price by 1 month and the TS by 6 months, but in the current model the first lag in two months. Five relevant best-fit models for AFL(t) are as follows:
AFL(t) = -5.02HFO(t-2) – 2.87TS(t-6) + 20.42(t-1990) + 997.71, March 2011
AFL(t) = -4.63HFO(t-0) – 2.90TS(t-5) + 20.41(t-1990) + 953.49, September 2011
AFL(t) = -4.63HFO(t-1) – 2.87TS(t-6) + 20.23(t-1990) + 948.72, December 2011
AFL(t) = -4.65HFO(t-1) – 2.86TS(t-6) + 20.20(t-1990) + 949.35, February 2012
AFL(t) = -4.43HFO(t-2) – 2.71TS(t-6) + 19.10(t-2000) + 1094.64, September 2012
where AFL(t) is the AFL share price in U.S. dollars, t is calendar time.
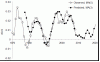
In March 2012, we predicted that the price would likely not change much in 2012Q1 and it stayed around $45. Figure 1 confirms our prediction. It depicts the high and low monthly prices for an AFL share together with the predicted and measured monthly closing prices (adjusted for dividends and splits). The model residual error ($3.84 for the period between July 2003 and September 2012) is depicted in Figure 2.
We do not see any large change in the price in November-December 2012 and will revisit the model in January for a new forecast.
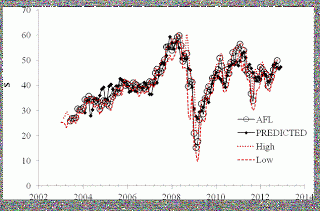
Figure 1. Observed and predicted AFL share prices.
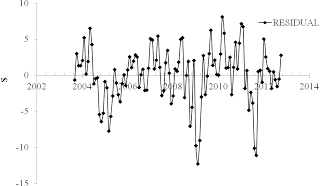
Figure 2. The model residual error $3.84.
2012-11-10 12:01:40
Source: http://mechonomic.blogspot.com/2012/11/aflac-inc-is-rather-stable-in-2012q4.html
Source:
