


Amount of Dollar GDP Added For Each Additional Dollar of US Federal Debt
Tuesday, May 28, 2013 22:25
% of readers think this story is Fact. Add your two cents.

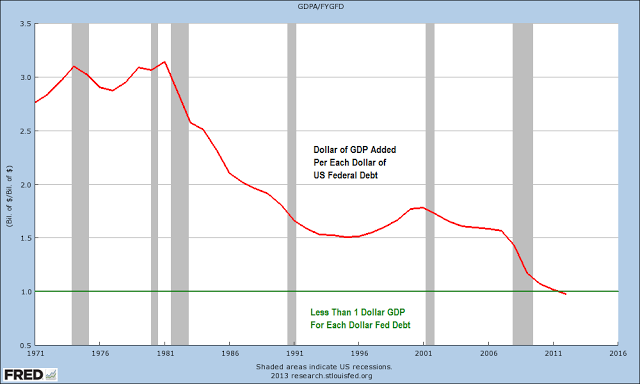 The line represents each dollar of GDP added for each incremental dollar of Federal Debt.
I would suggest that someone look into why the velocity of debt is now running into the law of diminishing returns. The big slide started with Reagonomics and the ‘supply side’ theory based on the second chart.
It might have something to do with a corrupt financial system, the myth of efficient markets and globalization, tax cuts for the wealthy and unfunded wars, and the largely stagnating median wage.
Continue Reading at JessesCrossroadsCafe.Blogspot.ca…
Source: http://financialsurvivalnetwork.com/2013/05/amount-of-dollar-gdp-added-for-each-additional-dollar-of-us-federal-debt/?utm_source=rss&utm_medium=rss&utm_campaign=amount-of-dollar-gdp-added-for-each-additional-dollar-of-us-federal-debt
