

| Online: | |
| Visits: | |
| Stories: |

Big Moves Developing in Strategic Markets

by Rambus, Gold Seek:
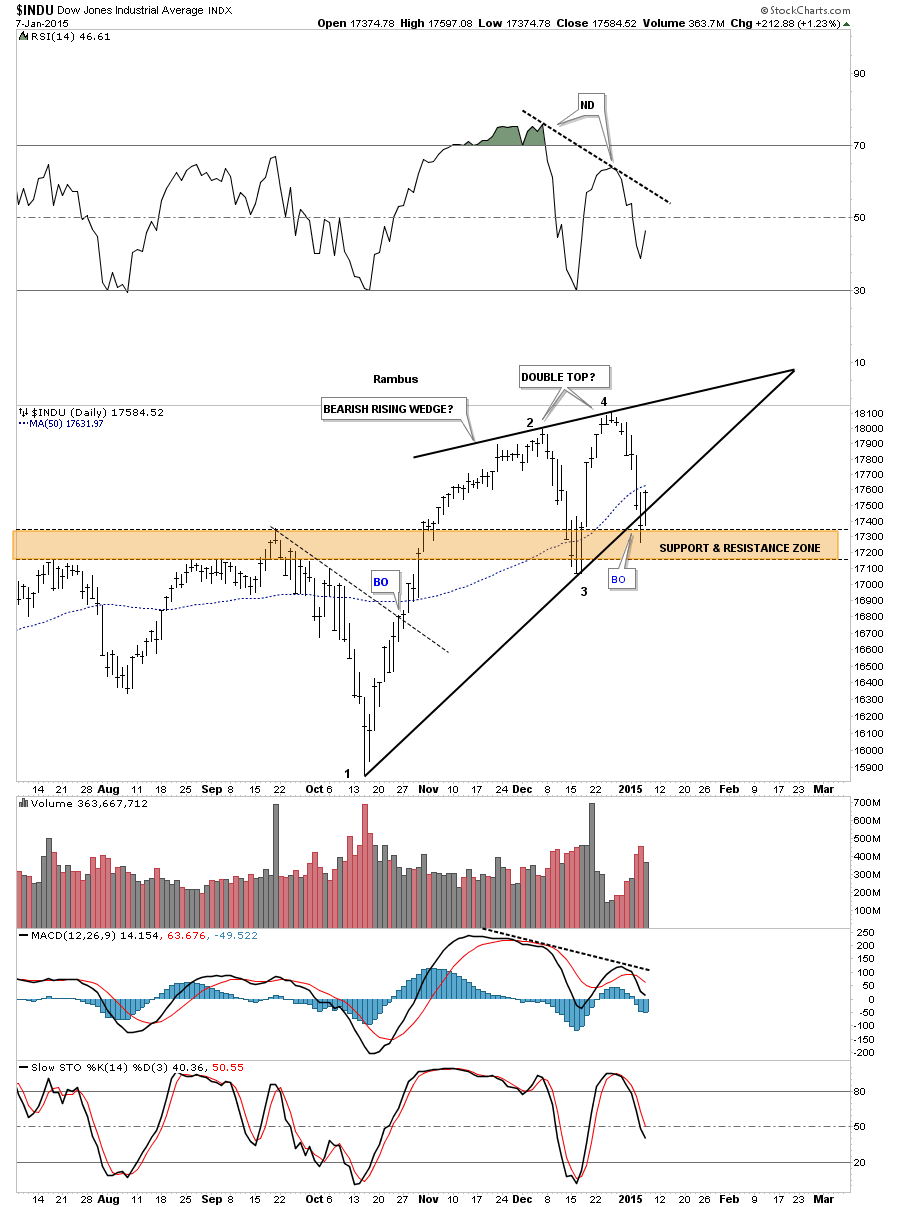 Tonight I would like to touch on several different areas in regards to our trades we have going right now. First lets look at the INDU and some of the reasons I went short yesterday. The daily chart shows a rising wedge in which the price action closed below the bottom rail yesterday. Today’s bounce was a little stronger than what I was hoping for closing above the bottom rail of the falling wedge. There is also another and I believe stronger chart pattern in play and that is a possible double top. As you can see on the rising wedge, reversal point #4 is higher than reversal point #2. When you look at the RSI, at the top of the chart, you can see a big negative divergence. The same holds true with the MACD at the bottom of the chart. The blue histogram is still negative and the slo sto is falling. The 50 dma comes in just above at 17,632 so all these indicators are negative.
