

| Online: | |
| Visits: | |
| Stories: |

How Important Is the Dow Jones Death Cross?

The history of the Dow Jones illustrates that we ignore ‘death cross’ signals at our own financial peril
from Josh Enomoto, Investor Place:
 Brian Sullivan of CNBC fame is clearly not a believer. In his Power Lunch segment, the usually agreeable on-air personality mockingly referred to the dreaded death cross in the Dow Jones Industrial Average as a “life cross” instead.
I wouldn’t be so quick to agree.
From a pure numbers perspective, a death cross occurs when the index’s shorter-term, 50-day moving average drops below its longer-term equivalent, the 200-day MA. Theoretically, the Dow Jones death cross forewarns volatility, but to Mr. Sullivan’s point, the harbinger was denied the last two times the cross was flashed.
To be fair, the CNBC anchor was only looking at data going back to 2010 — hardly enough information to establish statistical accuracy considering that the Dow Jones death cross is in fact a very rare phenomenon. Since Sept. 9, 1901, until the most recent occurrence on Aug. 11 of this year, the 50-day MA crossed below the 200-day a total of only 81 times.
To put this scope into perspective, there have been nearly 31,000 trading sessions between the aforementioned dates. At the oldest end of the spectrum, U.S. President William McKinley had been shot days earlier by anarchist Leon Czolgosz. The right for women to vote was roughly two decades away.
The relative infrequency of the Dow Jones death cross confirms the general stability of American markets.
But when this harbinger does ring out, investors ought to pay attention. Here are the stats, courtesy of a slew of data from Measuring Worth:
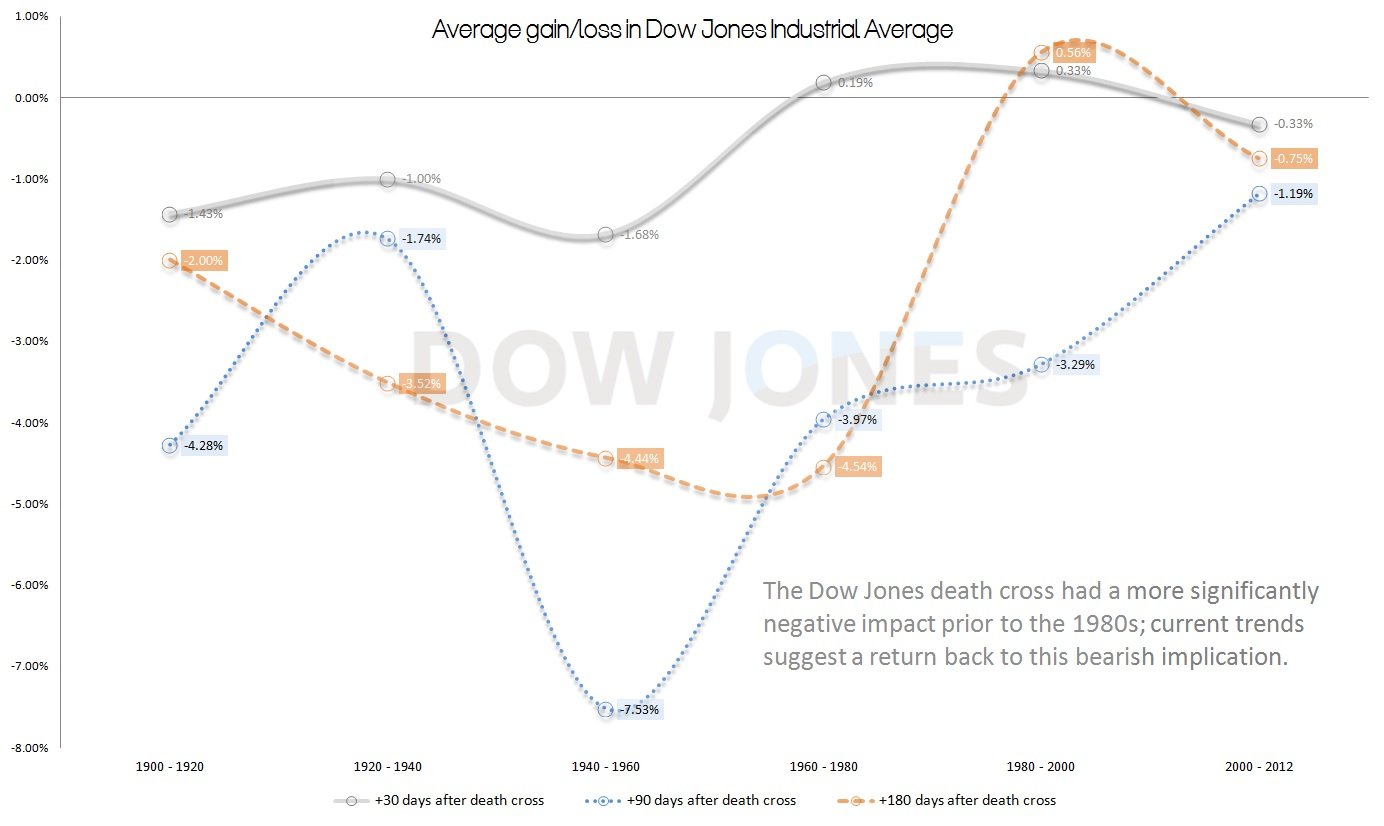
- A month after the initial onset of the death cross, the markets have moved lower 55% of the time.
- Three months later, the Dow is in the red 62.5% of the time.
- After 180 days have passed since a Dow Jones death cross, the markets begin to recover, but are still negative 55% of the time.
While a maximum accuracy rating of 63% may not sound like much, this is only a broad statistic. If we impose conditions into our analysis — via Bayes’ Theorem — it is possible to extract higher probabilities.
