
| Online: | |
| Visits: | |
| Stories: |

| Story Views | |
| Now: | |
| Last Hour: | |
| Last 24 Hours: | |
| Total: | |
Visualizing the Impact of California's Minimum Wage Hikes
How much will California's recently passed legislation to raise its minimum wage from its current level of $10.00 per hour to $15.00 per hour by 2021 (or 2022 at the latest) have upon the state's employment levels by age?
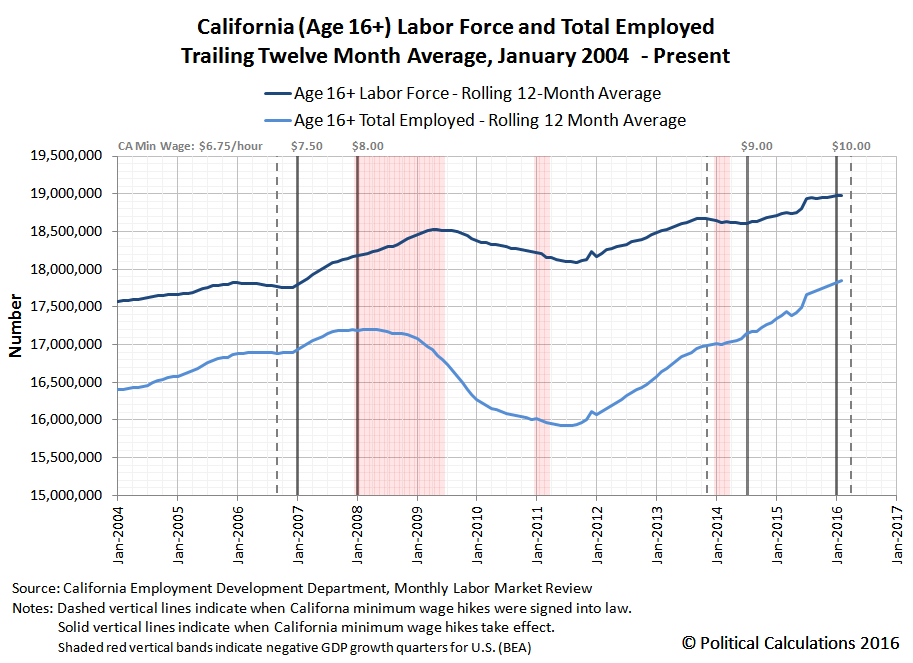
Before you answer, it might help to see what happened the last two times that California acted to hike its statutory minimum wage with respect to the state's labor force and number of employed. Our first chart below shows the period from January 2004 through February 2016 for Californians Age 16 or older.
In the chart above, we've identified the timing of when the state passed legislation to raise its minimum wage (vertical dashed lines) and also the timing of when the state enacted the minimum wage hikes (vertical solid lines) defined by that preceding legislation. Beyond that, we've also indicated the quarters in which the U.S. economy experienced negative real GDP growth (vertical red shaded bands).
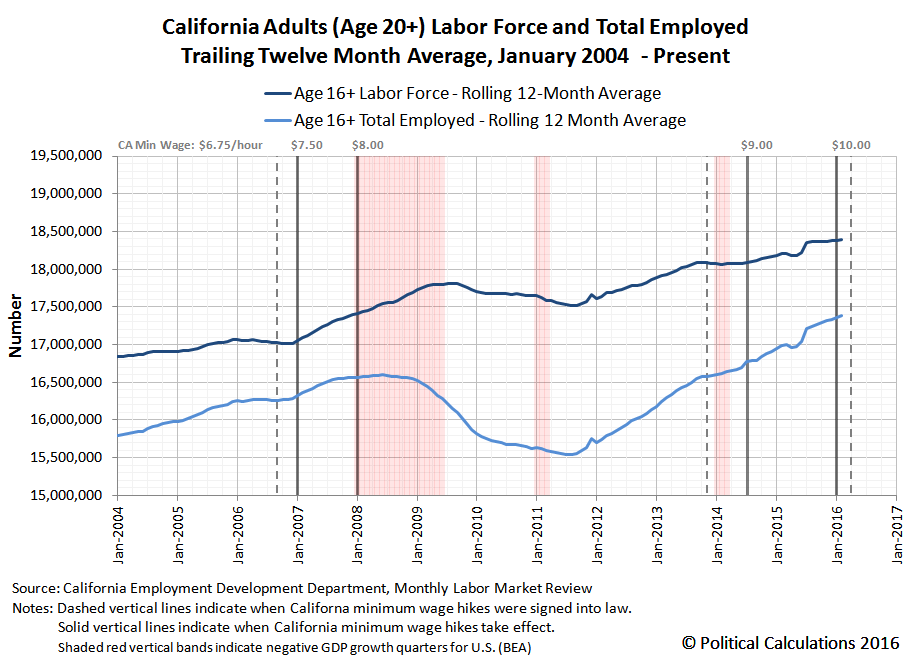
Next, let's look at California's adult labor force and number of employed, which we've defined as individuals Age 20 or older.
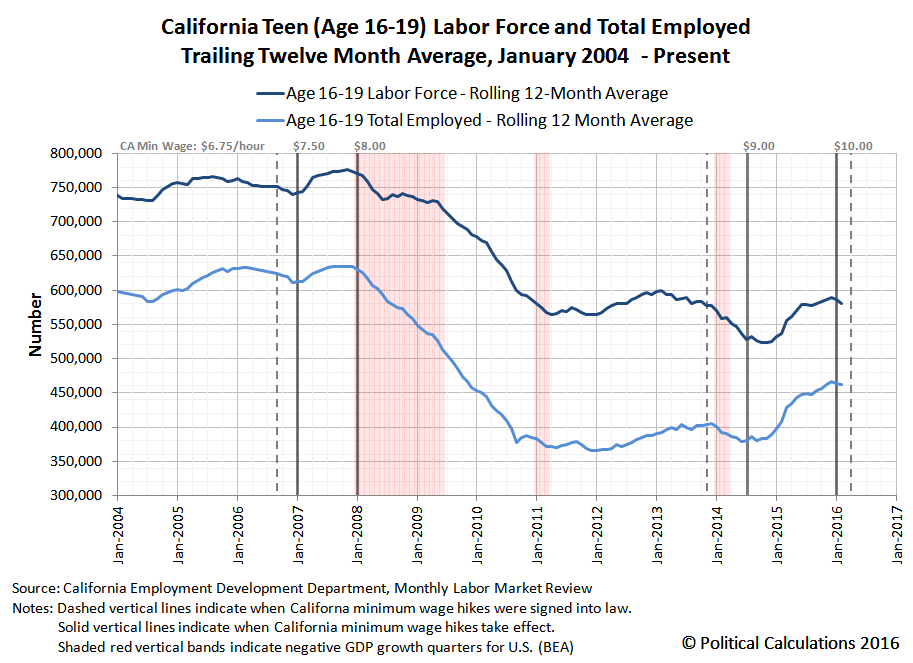
Now, compare what you see in this chart with what happened for California's teenage labor force, which we've illustrated in the following chart (please note the change in the scale of the vertical axis, which is different from the preceding two charts):
It's quite a different story for the individuals in California with the least amount of education, training and experience as compared to their better trained, more skilled and greater experienced peers in the labor force, isn't it?
That said, although we can perhaps draw a good hypothesis about what will happen between the present and 2022 from what we observe to have happened in the past, we're really more interested in what will actually influence what happens in the future. What factors might lead to a different outcome that what we've illustrated above? How might the state's politicians react if the state experiences another severe recession? And how will employers in California adapt their hiring practices in response to the state's new arbitrarily-determined minimum wage law?
Because all these things will play out in real time, the labor force and employment data we've visualized for each of these age groups is taken directly from California's Employment Development Department (EDD) monthly Labor Market Review, which directly presents the state's trailing twelve month average of non-seasonally adjusted labor force and employment data for the Age 16+ and Age 16-19 demographic groups (we subtract the Age 16-19 group from the Age 16+ group to get the data for Age 20+). The information you see above for a given month's labor force and employment levels is exactly what would have been known to California's resident labor force and its state legislators and officials within a month or two of the indicated month.
Meanwhile, the only information that reflects later refinements and revisions from the information that was previously reported is that of the negative real GDP growth quarters, which we've presented for the sake of providing some 20-20 economic hindsight for the state whose population makes up one-eighth of the entire population of the United States. This is information that California's residents and officials won't have available for quite some time after it becomes a fact of life.
We'll update these charts periodically over time as events warrant.
Data Sources
California Employment Development Department. Labor Market Review. [Latest edition: PDF Document - for previous editions, contact EDD]. Accessed 10 April 2016.
U.S. Bureau of Economic Analysis. National Income and Product Accounts. Table 1.1.1. Percent Change From Preceding Period in Real Gross Domestic Product. [Online Database]. Accessed 10 April 2016.
Source: http://politicalcalculations.blogspot.com/2016/04/visualizing-impact-of-californias.html


