


Atlanta Fed GDPNow Forecast Spirals Down in Amazing Manner

by Wolf Richter, Wolf Street:
![]() Where has all the optimism gone?
Where has all the optimism gone?
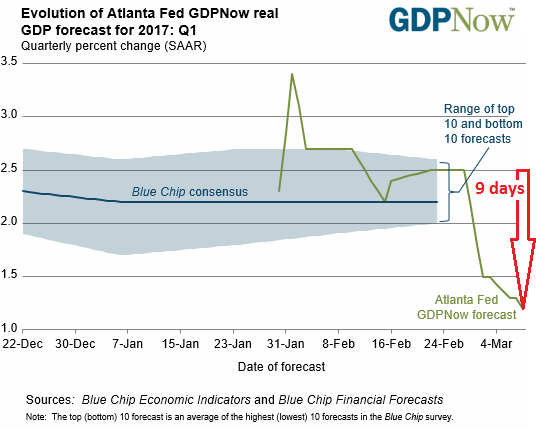
The Atlanta Fed’s GDPNow model, which forecasts GDP growth in the US in the current quarter, picks up data as it is released and changes the forecast in real time. As the quarter advances and as more data is included, it becomes a more accurate predictor, not of actual economic growth, but of GDP as measured in the first estimate for that quarter by the Bureau of Economic Analysis (BEA). So now we’re 67 days into the first quarter, and the GDPNow forecast has been spiraling down in an amazing manner for the past nine days.
The model now forecasts GDP growth in Q1 of 1.2% seasonally adjusted annual rate. This means that if the economy continues to grow at this rate for the rest of the year, annual GDP growth would be 1.2%, which would be the worst since the Financial Crisis.
Today’s down-tick from yesterday’s GDPNow forecast of 1.3% growth was caused by the contribution of “inventory investment” to GDP – when inventories rise or fall – as reported this morning by the Census Bureau in its wholesale trade data release. According to this data, the contribution of inventory investment to Q1 growth fell from -0.72 percentage points to -0.79 percentage points.
Yesterday’s release of the GDPNow forecast had plunged from 1.8%, as reported on March 1, to 1.3% due to three crummy data points on March 2, March 3, and March 6 that lowered growth forecasts:
Growth in real personal consumption expenditures fell from 2.1% to 1.8%.
Growth in real nonresidential equipment investment fell from 9.1% to 7.3%.
Contribution of inventory investment to Q1 growth fell from -0.50 percentage points to -0.72 percentage points.
The Atlanta Fed’s chart shows the 9-day plunge from 2.5% on February 27 to 1.2% today (red marks added):
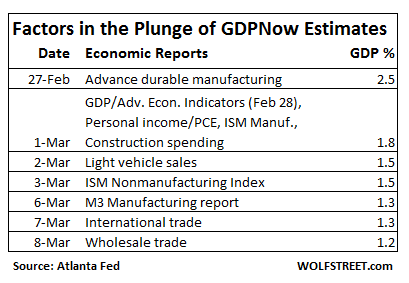
To forecast the BEA’s first estimate of real GDP growth, the GDPNow model aggregates forecasts of 13 sub-components of GDP. These are the data inputs since February 27 that have caused the forecast to spiral down:
So how bad is annualized real GDP growth of 1.2%? We hope it’s just a brief dip in the data. Because if this type of growth becomes reality for the rest of the year, it would be even worse than in 2016, when GDP inched up 1.6%, which matched the GDP growth rate of 2011, both of which were the worst growth rates since crisis-year 2009.
Consumer and business surveys have reported a surge in sentiment since the election, and the stock market has rallied in a further sign of ebullient sentiment by investors, hoping that consumer and business sentiment surveys would somehow translate into something real, or at least into higher stock prices, which is all that matters. While these ebullient levels of sentiments have translated into higher stock prices, they do not appear to have translated into anything real.
