
| Online: | |
| Visits: | |
| Stories: |

| Story Views | |
| Now: | |
| Last Hour: | |
| Last 24 Hours: | |
| Total: | |
New Home Sales Stalling Again?
About once a quarter, we calculate the market capitalization for the U.S. new home market, where we multiply the number of reported new home sales each month by their reported average sale prices. Once we have those figures, we calculate trailing 12 month average of these market cap figures to account for annual seasonality in the sales data, which we then visualize in the form of charts.
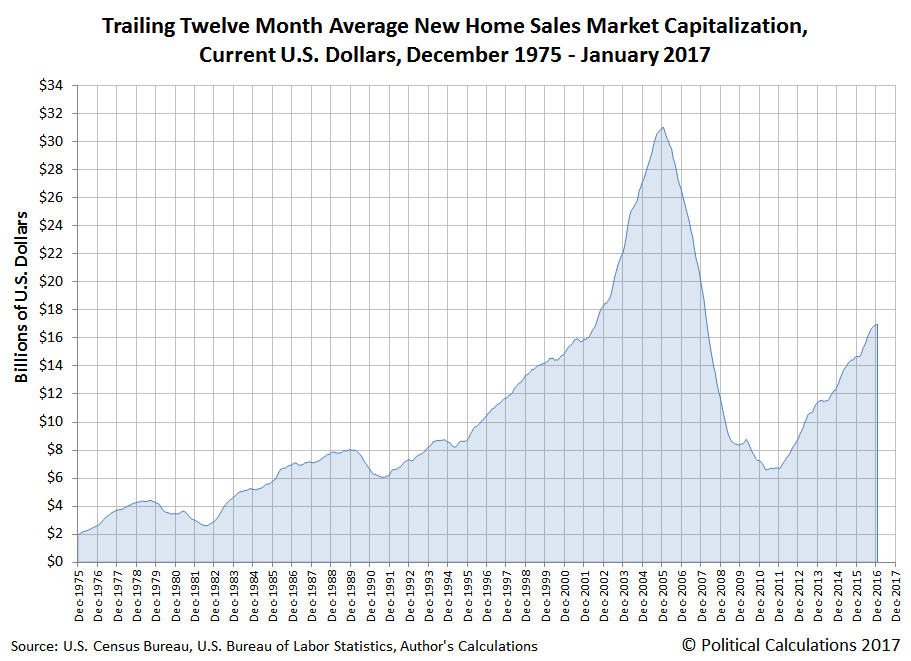
The results of that exercise can tell us quite a lot about the state of the new home market in the U.S., which for this edition, suggests that new home sales are stalling out once again, indicating that things are slowing down for the U.S. homebuilding industry. The following chart shows what we found in nominal terms.
The deceleration appears to have taken hold beginning in October 2016, when the rate of growth of the U.S. new home market cap suddenly downshifted to grow much more slowly, slowing in each month since through January 2017, as the market cap's trailing year average neared $17 billion.
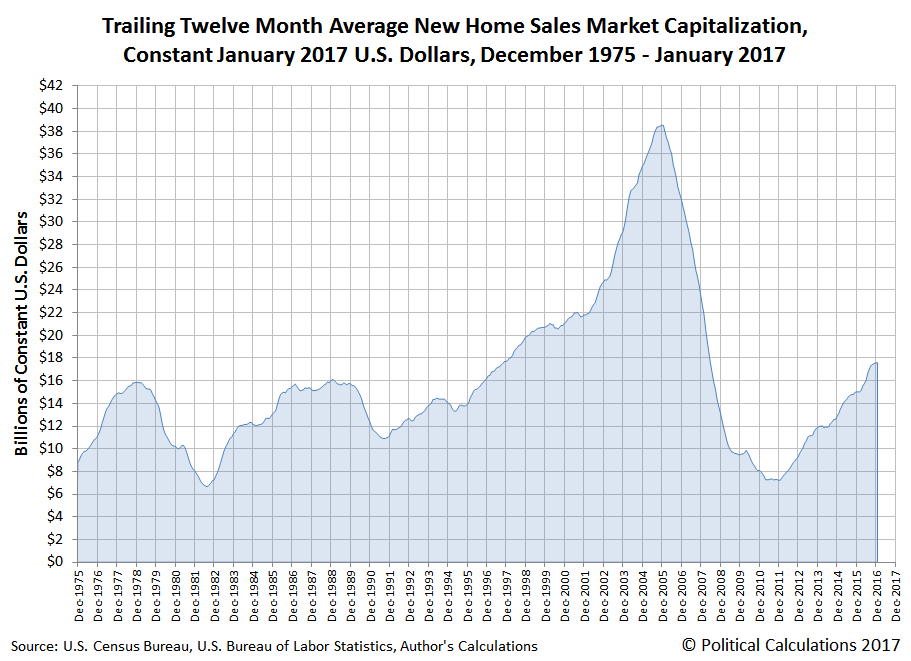
The following chart shows the same data, but this time adjusted for inflation, so that all the historic market cap values for the U.S. new home market are shown in terms of constant January 2017 U.S. dollars.
In both charts, we see that this is the third time since the market for new homes bottomed in January 2011 that the growth of the new homes market cap has sputtered to a near stall after a period of relatively strong growth. We'll need to dig more into the data for 2016 to find out what the driving factors are behind the change since September 2016, which we'll follow up later this week.
Data Sources
U.S. Census Bureau. New Residential Sales Historical Data. Houses Sold. [Excel Spreadsheet]. Accessed 1 March 2017.
U.S. Census Bureau. New Residential Sales Historical Data. Median and Average Sale Price of Houses Sold. [Excel Spreadsheet]. Accessed 1 March 2017.
U.S. Department of Labor Bureau of Labor Statistics. Consumer Price Index, All Urban Consumers – (CPI-U), U.S. City Average, All Items, 1982-84=100[Online Application]. Accessed 1 March 2017.
Source: http://politicalcalculations.blogspot.com/2017/03/new-home-sales-stalling-again.html


