
| Online: | |
| Visits: | |
| Stories: |

| Story Views | |
| Now: | |
| Last Hour: | |
| Last 24 Hours: | |
| Total: | |
Seasonal Patterns
A lot of business and economic data shows seasonal patterns. One example of data that shows a remarkably seasonal pattern is the total value of shipments delivered by beverage manufacturers to their distributor customers, which often precedes the actual consumption of these bottled and canned drinks by their end consumers in anywhere from a matter of days to several weeks.
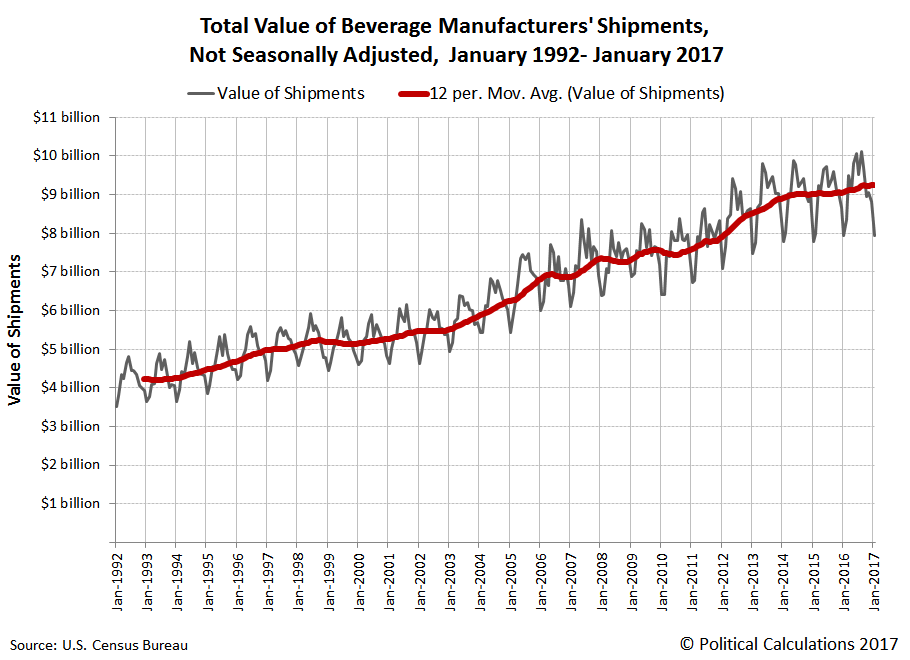
The following chart shows that data for U.S. beverage manufacturers for each month from January 1992 through January 2017.
In this chart, we can see that the not seasonally-adjusted data follows a remarkable similar pattern from year to year, which has strongly persisted over time even as the rolling 12-month average of these shipments has more than doubled from 1992 through 2016. Perhaps more remarkably, we can see the overall magnitude in the swings from one season to the next grow in size as the total value of shipments has increased.
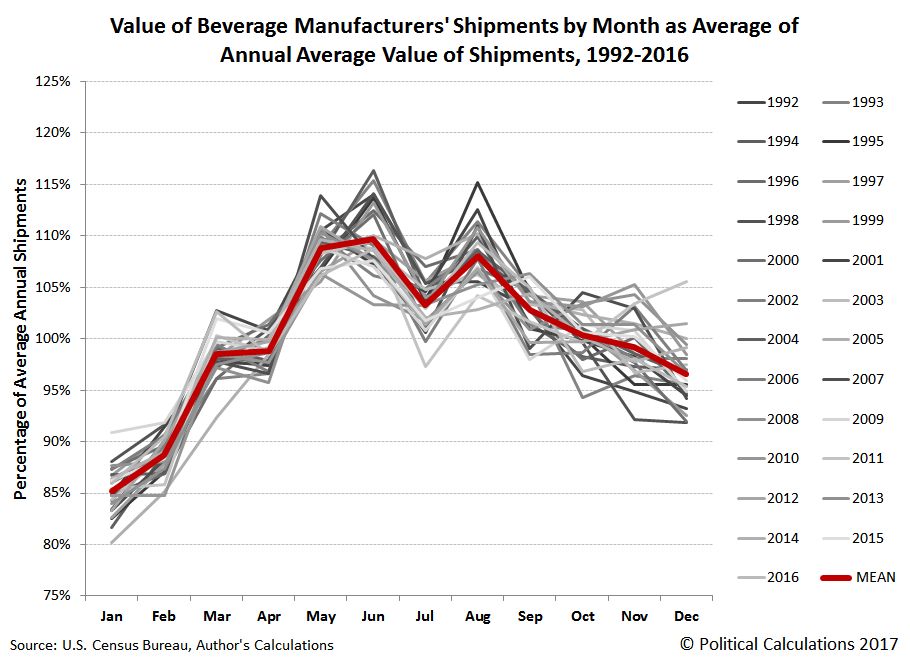
To better visualize that seasonal variation, we calculated the mean value of beverages shipped each month by their U.S. manufacturers in each year, then calculated the percentage that each month's total shipment value represents with respect to that average value, where a value of 100% would coincide with a month's shipments being equal to the annual average for the year in which it occurred. The results of that math are shown in the following chart.
With the data indexed with respect to each year's average total shipment value, we see that the seasonal swings are really pretty consistent over time, where the increasing magnitude indicated by the first chart is a result of the same size percentage swings being applied to the increased overall value of shipments.
At the same time, we see that January in each year marks the lowest number of shipments, coming in at roughly 85% of the average monthly value recorded during the year. The value of shipments then predictably increases through March, holds flat in April, then resumes increasing before typically peaking in June. Much of this pattern coincides with rising temperatures in the U.S. as the weather transitions from winter to spring and then to summer, which represents the peak period for manufactured beverage consumption in the U.S.
In July, the total value of beverage shipments falls in each year before rising to peak once more in August, which is then followed by a relatively steady decline in each following month through December. The cycle then repeats with the value of beverage shipments crashing to their January lows in the next year.
The June-July-August peak-dip-peak is also remarkable in showing the advance delivery of beverages ahead of their periods of peak consumption, where June shipments supply consumption during the U.S.' Fourth of July holiday and the August shipments are supporting consumption during the period of the U.S. Labor Day holiday, which falls on the first Monday in September each year.
This data is something that we dug up as part of another project, which we will get to in the very near future. For now, we thought it was perhaps interesting enough to present on its own as a data visualization exercise, and because major U.S.-owned beverage manufacturers like Coca Cola (NYSE: KO), PepsiCo (NYSE: PEP), Dr. Pepper Snapple Group (NYSE: DPS), National Beverage Corporation (NASDAQ: FIZZ) and a considerable number of smaller public firms, private firms and foreign-owned beverage manufacturers with U.S. production facilities could use a hug!
Data Source
U.S. Census Bureau. Beverage Manufacturing: U.S. Total, Not Seasonally Adjusted Value of Shipments [Millions of Dollars], Period: 1992 to 2017. Manufacturers' Shipments, Inventories, and Orders. [Online Database]. Data Extracted on: 28 March 2017.
Source: http://politicalcalculations.blogspot.com/2017/03/seasonal-patterns.html


