
| Online: | |
| Visits: | |
| Stories: |

| Story Views | |
| Now: | |
| Last Hour: | |
| Last 24 Hours: | |
| Total: | |
The S&P 500 in Week 2 of March 2017
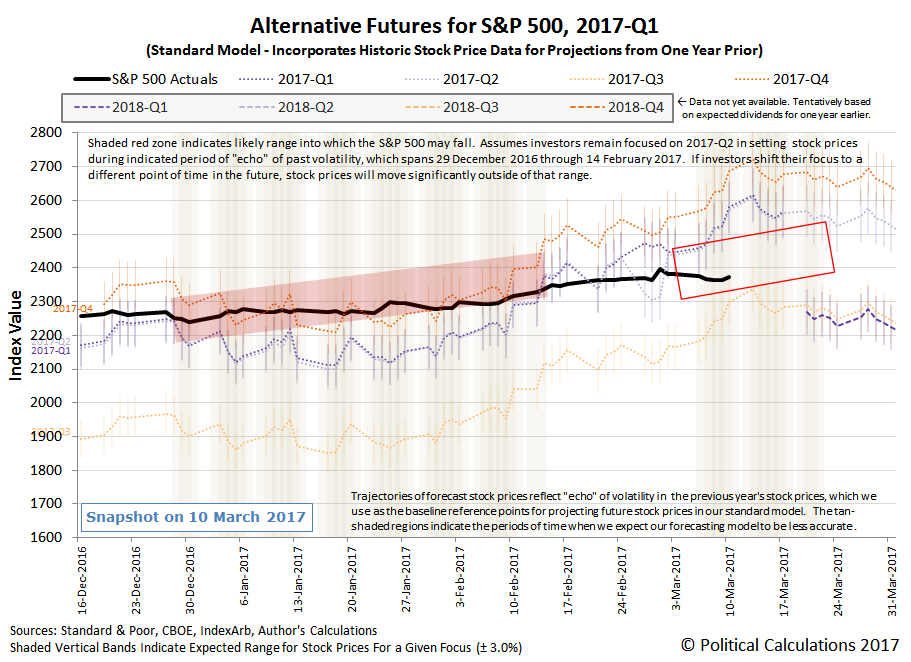
The S&P 500 in Week 2 of March 2017 ended just ever-so-slightly below where it opened the week. After generally trending downward on the week, the S&P 500 recovered much of what the index had lost on Friday, 10 March 2017.
Our alternative futures chart updates the trajectory that the S&P 500's closing prices took in the second week of March 2017 against the backdrop of what our dividend futures-based standard model projected, based on a combination of historical stock prices and the expectations that investors have for the amount of dividends per share to be paid out through specific points of time in the future.
That brings us to the one thing that really drew your eyes in this week's updated chart – that red box outlining where the S&P 500's closing stock prices on each day of the week fell. The one that we teased at the end of last week's edition!
Like the previous red-shaded box, the new red-lined box represents our prediction of the range into which the S&P 500 will close over the indicated period of time during the indicated period of time, which runs from 3 March 2017 through 21 March 2017. We've drawn both boxes on top of our standard model's projections in order to account for the effect of the echo of past volatility on our standard model's projections, which arises as a result of our model's use of historic stock prices as the base reference points from which we project future stock prices.
Unlike the previous red-shaded box shown on the chart, the starting point is not aligned with the projected trajectory that corresponds with the future quarter that we believe investors have fixed their forward-looking attention upon in making their current day stock prices, which we believe to be the current quarter of 2017-Q1 based on the Fed's recent concerted efforts to convince market participants that it will next hike short term interest rates in the U.S. before the end of the quarter.
In doing that, we're trying something new, which draws upon our observation that the trajectory of stock prices are very much like a kinematics problem from physics. In such a problem, the actual trajectory that a body in motion that is being acted upon by external forces might take is anchored by its starting position.
So what we've done is to shift the forecast range that corresponds to where our standard model projects for investors fixing their attention on 2017-Q1 (and also 2017-Q2, since that future quarter's expectations are nearly identical to those of 2017-Q1) downward, to adjust for the starting value of the period of time covered by our prediction. We should note that if investors should shift their forward-looking attention to a different point of time in the future with different expectations associated with it, such as 2017-Q3 or 2017-Q4, stock prices will move outside the predicted range indicated by the red-lined box.
One week into this particular forecasting experiment, it seems to be working, but we have another week and a half to go. Until then, here are the headlines that caught our attention during the second week of March 2017….
- Monday, 6 March 2017
-
- Headline from before the market opened: Futures fall amid North Korea missiles, Trump wiretap talk
- Headline from after the market closed: Wall Street slips on wiretap accusation, geopolitical worries
- It's not your imagination – that was the only notable news/noise for the day!
- U.S. oil prices slip on rising shale oil forecasts
- Tuesday, 7 March 2017
-
- If you read closely, you'll find that all of Tuesday's news headlines are related….
- Atlanta Fed reduces U.S. first-quarter GDP view to 1.3 percent
- Oil imports lift U.S. trade deficit to near five-year high
- Confronted by market doubts, Federal Reserve drove March rate rise expectations
- Stocks slip, U.S. dollar firm on Fed outlook
- Wednesday, 8 March 2017
- Thursday, 9 March 2017
- Friday, 10 March 2017
For a bigger picture of the week that was, Barry Ritholtz lists the week's positives and negatives for the U.S. economy. If you're a fan of business and finance-oriented podcasts, you might consider checking out Bloomberg's Masters in Business series, which Barry hosts. Speaking of podcasts, we would also strongly recommend Russ Roberts' Econtalk (which recently posted its rankings of its most popular sessions for 2016, and also the BBC's brilliant 50 Things That Made the Modern Economy, which is presented by More or Less' Tim Harford and which features excellent production values while packing an amazing amount of information into its 9-minute-long episodes.
Source: http://politicalcalculations.blogspot.com/2017/03/the-s-500-in-week-2-of-march-2017.html


