
| Online: | |
| Visits: | |
| Stories: |

| Story Views | |
| Now: | |
| Last Hour: | |
| Last 24 Hours: | |
| Total: | |
Visualizing the Current Period of Order in the S&P 500
Wednesday, April 5, 2017 1:25
% of readers think this story is Fact. Add your two cents.
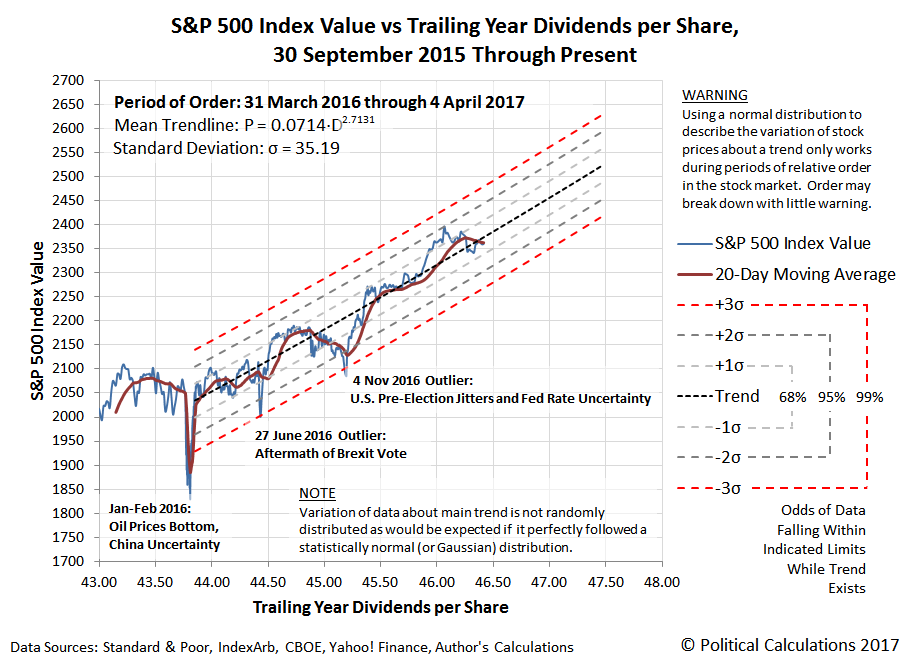
We're going to try to tell a remarkable story that spans just over a year of stock market history with just one chart. Enjoy!
The current period of order in the S&P 500 has nearly fallen apart on three separate occasions thanks to nearly globe-rocking events in the year from 31 March 2016 through 4 April 2017, but it has managed to endure through its one-year anniversary.
That's not to say that it all won't end tomorrow (probably not), but at the very least, we can guarantee that there will be no mistaking when it does end!
Source: http://politicalcalculations.blogspot.com/2017/04/visualizing-current-period-of-order-in.html


