


| Story Views | |
| Now: | |
| Last Hour: | |
| Last 24 Hours: | |
| Total: | |
Global temperature change has increased risks of extreme summer heat and crop failures

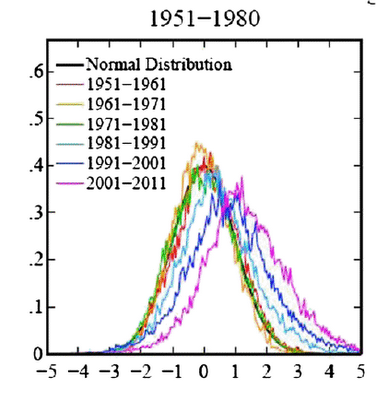 |
| Frequency of temperature deviation from baseline (y) versus interval in the standard normal distribution (x) defined by the baseline pattern. Colour code indicates the decade of observation period, baseline is 1951-1980, Northern hemisphere land data. |
A display of how climate dice have become successively more loaded to higher global temperatures over recent decades has been provided by James Hansen, Makiko Sato, and Reto Ruedy at the Proceedings of the National Academy of the USA. It is a great illustration of how risks arise not from shifts in average values, but mainly from changes to “the tail” in frequency distributions. They have normalised temperatures measured during summer months in 250 square Km regions of the globe, and plotted the frequency atwthich deviations from a baseline (1951-1980) period occur. Deviations on the selected figure from the paper (horizontal axis) are represented in units (1 S) of standard deviation for the baseline reference time period. In the last decades the risk of more than 3 S increased temperature has risen dramatically.
Hot summers and summer crop failures are on the rise, with serious implications for food security
@ Perception of climate change: PNAS USA August 6 2012
See also The Economist article about the Hansen report:
Climate change: Bell weather
A statistical analysis shows how things really are heating up Aug 11th 2012
2012-09-01 18:13:58
Source: http://gmopundit.blogspot.com/2012/09/global-temperature-changes-has.html
Source:
