


| Story Views | |
| Now: | |
| Last Hour: | |
| Last 24 Hours: | |
| Total: | |
GMO Statistics Part 20. Discrete Events. It’s the tests Gilles-Eric rejects that make Gilles-Eric the best.


Controversial researcher Gilles-Eric Seralini rejects the idea of applying statistical tests on discrete variables observed in biological studies. Discrete variables studied in biology include such events as counts of rodent deaths or counts of animal tumours for instance.
Siméon Denis Poisson (1781–1840) developer of the Poisson variable concept, and author of Recherches sur la probabilité des jugements en matière criminelle et en matière civile (“Research on the Probability of Judgments in Criminal and Civil Matters”), would turn in his grave. Student would be upset too.
The (disrete) Poisson Distribution is described in a Wikipedia entry.
In probability theory and statistics, the Poisson distribution (pronounced [pwasɔ̃]) is a discrete probability distribution that expresses the probability of a given number of events occurring in a fixed interval of time and/or space if these events occur with a known average rate and independently of the time since the last event.[1] (The Poisson distribution can also be used for the number of events in other specified intervals such as distance, area or volume.)
For instance, suppose someone typically gets on the average 4 pieces of mail per day. There will be, however, a certain spread: sometimes a little more, sometimes a little less, once in a while nothing at all.[2] Given only the average rate, for a certain period of observation (pieces of mail per day, phonecalls per hour, etc.), and assuming that the process, or mix of processes, that produce the event flow are essentially random, the Poisson distribution specifies how likely it is that the count will be 3, or 5, or 11, or any other number, during one period of observation. That is, it predicts the degree of spread around a known average rate of occurrence.[2]…
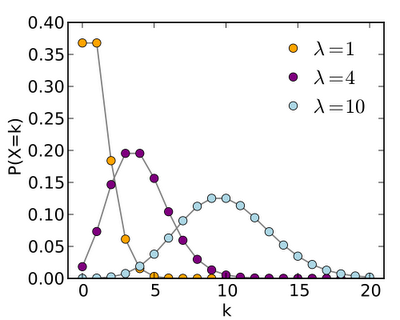 |
| Poisson probability mass function. The horizontal axis is the index k, the number of occurrences. The function is only defined at integer values of k. The connecting lines are only guides for the eye. |
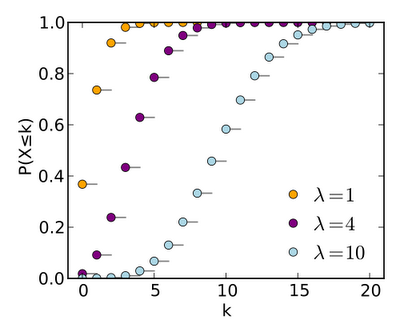 |
| Poisson Cumulative probability function. The horizontal axis is the index k, the number of occurrences. The CDF is discontinuous at the integers of k and flat everywhere else because a variable that is Poisson distributed only takes on integer values. |
2012-10-30 13:43:40
Source: http://gmopundit.blogspot.com/2012/10/gmo-statistics-part-20-discrete-events.html
Source:
