


| Story Views | |
| Now: | |
| Last Hour: | |
| Last 24 Hours: | |
| Total: | |
GMO Statistics Part 32. Scientific discoveries about implausible guesses are very like to be false

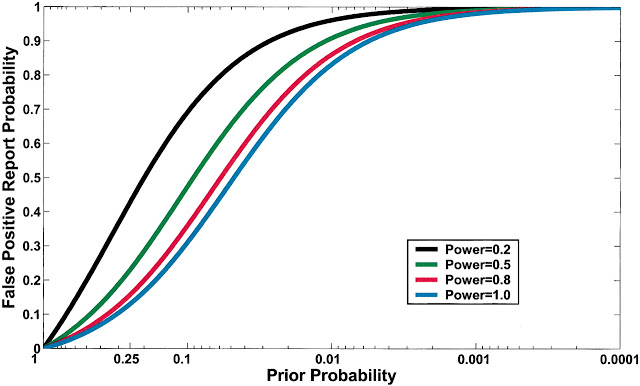 |
| Fig. 1.Effect of changes in prior probability and statistical power on false positive report probability (FPRP) when the α level is .05. FPRP shown is for a P value at or just below α; FPRP will be lower when the observed P value is substantially below α. A low FPRP is achievable only for high prior probabilities. Moreover, statistical power has an important impact on FPRP, except for particularly high and low prior probabilities. For example, for a prior probability of 0.1, the FPRPs are 0.69, 0.47, 0.36, and 0.31 for statistical powers of 0.2, 0.5, 0.8, and 1. |
Assessing the Probability That a Positive Report is False: An Approach for Molecular Epidemiology StudiesSholom Wacholder, Stephen Chanock, Montserrat Garcia-Closas, Laure El ghormli and Nathaniel Rothman, JNCI J Natl Cancer Inst (2004) 96 (6): 434-442. doi: 10.1093/jnci/djh075 (Free access pdf)
From the Summary: Too many reports of associations between genetic variants and common cancer sites and other complex diseases are false positives. A major reason for this unfortunate situation is the strategy of declaring statistical significance based on a P value alone, particularly, any P value below .05. The false positive report probability (FPRP), the probability of no true association between a genetic variant and disease given a statistically significant finding, depends not only on the observed P value but also on both the prior probability that the association between the genetic variant and the disease is real and the statistical power of the test. In this commentary, we show how to assess the FPRP and how to use it to decide whether a finding is deserving of attention or “noteworthy.” We show how this approach can lead to improvements in the design, analysis, and interpretation of molecular epidemiology studies. Our proposal can help investigators, editors, and readers of research articles to protect themselves from overinterpreting statistically significant findings that are not likely to signify a true association. An FPRP-based criterion for deciding whether to call a finding noteworthy formalizes the process already used informally by investigators—that is, tempering enthusiasm for remarkable study findings with considerations of plausibility…
About False FPRP…In the absence of bias, three factors determine the probability that a statistically significant finding is actually a false-positive finding. First is the magnitude of the P value (2,8,12–14). Second, and less appreciated, is statistical power (2,8,14,15), which is often low because, with few exceptions, the odds ratio for genetic variants that are truly associated with a disease is less than 2 or the genetic variant is uncommon. Third, but of primary importance as we (6,14) and others (2,8,15,16) have noted, is the fraction of tested hypotheses that is true. In this commentary, we show how to 1) calculate FPRP from its three determinants and 2) develop a criterion based on the FPRP for evaluating whether a study finding is noteworthy. We then demonstrate how this approach can be used in the design, analysis, and interpretation of molecular epidemiology studies.
Determinants of FPRP (False positive discovery report probability)Three factors determine the magnitude of the FPRP (seeequation 1 in Appendix): 1) prior probability π of a true association of the tested genetic variant with a disease, 2) α level or observed P value, and 3) statistical power to detect the odds ratio of the alternative hypothesis at the given α level or P value. Statistical power is in itself based on sample size, frequency of the at-risk genetic variant, and the specified odds ratio for the presumed association under the alternative hypothesis. A high FPRP (e.g., >.5) could be a consequence of any combination of a low prior probability, low statistical power, or a relatively high P value.
FPRP Under Different ScenariosCurrent practice in molecular epidemiology studies is to set an arbitrary value for the α level, usually .05, and to call an association between a genetic variant and a disease with a P value below α statistically significant. Fig. 1 shows that differences in the prior probability level over the range of three or more orders of magnitude between the most likely and least likely hypotheses that are typically tested have a large effect on FPRP. With a moderate prior probability, FPRP can be high, even for a study with reasonable statistical power, when the observed P value is close to .05. Although a substantial reduction in the FPRP can be achieved for moderate to high prior probabilities (i.e., 0.10–0.25) by increasing statistical power, FPRP will be high for prior probabilities below 0.01, even with the maximum statistical power of 1 (i.e., the blue curve on Fig. 1). The reduction in FPRP is small when statistical power is higher than 0.8 and, accordingly, even when sample size is increased dramatically, especially with low prior probabilities.
See also earlier post at GMO Pundit:
- Prior Bias and the False-Positive problem in the news at Forbes
- DNA Statistics Part 25. Prior knowledge is useful for forming sound judgements
2012-11-29 20:20:52
Source: http://gmopundit.blogspot.com/2012/11/gmo-statistics-31-scientific.html
Source:
