


| Story Views | |
| Now: | |
| Last Hour: | |
| Last 24 Hours: | |
| Total: | |
Graph of the Day: Total Annual Inflow to Perth Dams, 1911-2012
Friday, November 16, 2012 19:42
% of readers think this story is Fact. Add your two cents.

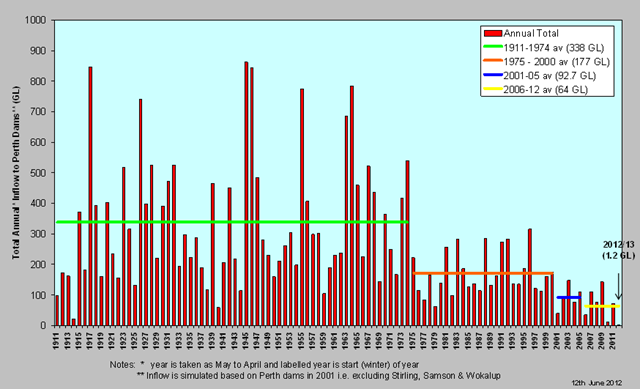
This graph shows how the average amount of water received into Perth dams has dropped dramatically in recent times.
In order to provide an accurate comparison Stirling, Wokalup, and Samson Brook Dams are not included in this data, as these Dams only came online in 2001. Inflow is therefore simulated based on Perth dams pre 2001.
Year is taken as May to April and labeled year is start (winter) of year.
Yearly streamflow for major surface water sources
2012-11-16 19:06:50
Source: http://www.desdemonadespair.net/2012/11/graph-of-day-total-annual-inflow-to.html
Source:
