


| Story Views | |
| Now: | |
| Last Hour: | |
| Last 24 Hours: | |
| Total: | |
Graph of the Day: Biological condition in rivers and streams across nine U.S. ecoregions

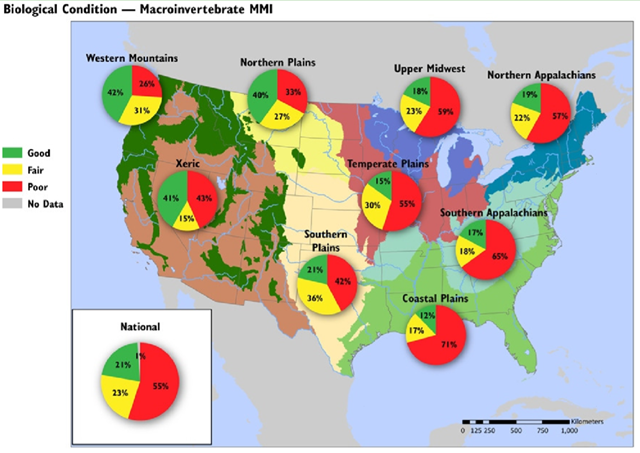
28 February 2013 (EPA) – The proportion of rivers and streams in poor biological condition, based on the Macroinvertebrate MMI, ranges from 26% in the Western Mountains ecoregion to 71% in the Coastal Plains ecoregion.
The three most widespread stressors to rivers and streams — phosphorus, nitrogen, and riparian vegetative cover are depicted by ecoregion.
A clear pattern is evident: the easternmost ecoregions (generally east of the Mississippi River) have a higher proportion of rivers and streams scoring in poor biological condition than those in the western U.S. In the east, the percent of river and stream miles in poor biological condition ranges from 55% to 71%. In the western ecoregions, the percent in poor biological condition ranges from 26% to 43%.
2013-04-27 10:30:56
Source: http://www.desdemonadespair.net/2013/04/graph-of-day-biological-condition-in.html
Source:
