
| Visitors Now: | |
| Total Visits: | |
| Total Stories: |

| Story Views | |
| Now: | |
| Last Hour: | |
| Last 24 Hours: | |
| Total: | |
Durable Goods Orders Really Did Stink, But Does It Matter?
Courtesy of Lee Adler of the Wall Street Examiner
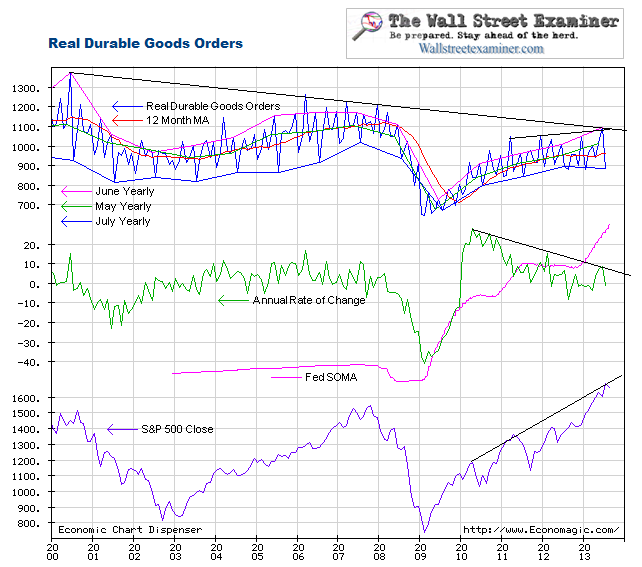
9/27/12 August Real Durable Goods Orders, adjusted for inflation and not seasonally manipulated, dropped 8.3% year over year. That compares with a 5% year to year gain in July. It was the first drop since March, and the biggest decline since December 2009.
Note: In adjusting for inflation, this measure attempts to represents actual unit volume of orders. Also, the use of actual, not seasonally adjusted (NSA), versus seasonally adjusted (SA) data allows an accurate view of the trend. With SA data, this may not be the case, since SA data can overstate or understate the real underlying change by attempting to fit the data to a standardized curve. There are no such issues when using the actual data (see Why Seasonal Adjustment Sucks).
Overall new orders volume remains well below the 2004 through 2007 levels, and the August data is a reversal from the slow uptrend that followed the dramatic rebound of 2009-10.
The month to month decline was 1.4%. This is another piece of bad news, since August is virtually always an up month. The August gain was 13.5% in 2011 and 10.3% in 2012. The average August change over the previous 10 years was a gain of 12.9%. This year’s change was much worse than both the last two years and the 10 year average. It more than reverses a stronger than typical performance in July. It also follows the pattern of weaker withholding tax collections in August that probably suppressed big ticket sales. However, withholding has recovered in September to near the highest levels of the year, so it will be interesting to see if durable goods orders recover in September.
The data is quite volatile month to month but on the chart you can see that this month’s data represents a clear weakening and possible trend reversal. Another year to year decline next month would be a nail in the coffin.
The headline number was a 13.2% drop month to month, seasonally adjusted (SA). That was much worse than ‘conomists consensus of a decline of 5%. As usual, they were looking at the wrong data. The real time withholding tax data showed the economy softening in August which was a tipoff that August data would be worse than expected.…
2012-09-30 06:23:05
Source: http://www.philstockworld.com/2012/09/29/durable-goods-orders-really-did-stink-but-does-it-matter/
Source:


