


| Story Views | |
| Now: | |
| Last Hour: | |
| Last 24 Hours: | |
| Total: | |
A Three Year Graphical Journey along the $ZB_F Chart
Wednesday, November 14, 2012 1:50
% of readers think this story is Fact. Add your two cents.

The below chart is worth a 1000 words, and in this case trillions of dollars. Should we be betting on a ‘fiscal cliff’ driven rally in bond prices, driving rates to record low levels in the next 5 weeks? Perhaps pushing the 30 year bond into 160? Note the annotations prefixing each rally and break into new high price and low rate territory..
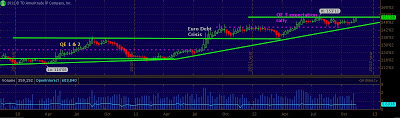 |
| weekly ZB_F |
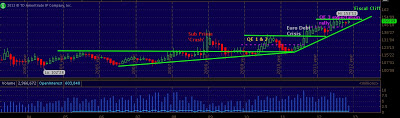 |
| Monthly ZB_F |

2012-11-14 01:00:06
Source: http://www.hedgeaccording.ly/2012/11/a-three-year-graphical-journey-along.html
Source:
