


| Story Views | |
| Now: | |
| Last Hour: | |
| Last 24 Hours: | |
| Total: | |
Intermediate-term Implications of the CBI Hitting 11 on Friday

I’ve written an awful lot about the Quantifiable Edges Capitulative Breadth Indicator (CBI) here on the blog. The CBI moved up from 9 to 11 on Friday. Many readers are aware that a reading of 10 or higher has been a strong short-term bullish signal over the years. But I have not discussed intermediate-term implications of high readings before, except in the Subscriber Letter. Below is a study from last night’s Letter with results of buying the SPX when the CBI reaches 11 or higher and then selling 20 days later.
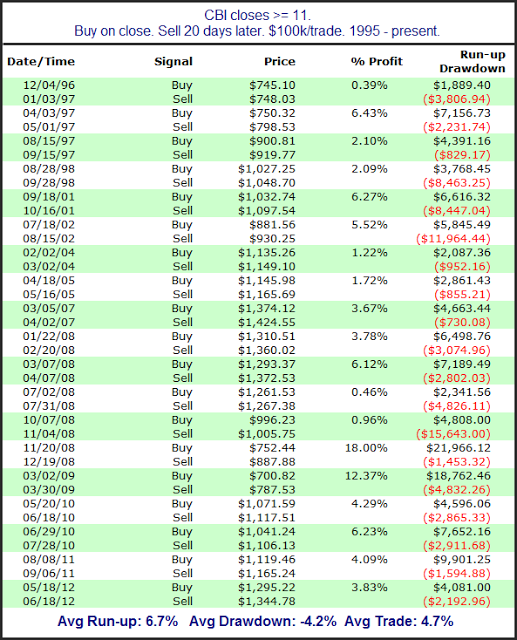
As you can see, SPX has been a perfect 19-0 when looking out 20 days from the first CBI reading of 11+. Drawdown stats are larger than most traders would prefer. Still, it appears a reading of this magnitude often suggests a washout is in progress that should set the stage for at least a multi-week bounce. We may not reach the “final” bottom here, but this study indicates we should see at least a temporary bottom form soon.
quantifiableedges.blogspot.com
2012-11-19 19:02:14
Source: http://quantifiableedges.blogspot.com/2012/11/intermediate-term-implications-of-cbi.html
Source:
