| Online: | |
| Visits: | |
| Stories: |
G7 Has Their Day
Good Morning Traders,
As of this writing 4:30 AM EST, heres what we see:
US Dollar: Up at 95.750, the US Dollar is up 29 ticks and trading at 95.750.
Energies: July Crude is up at 58.45.
Financials: The Sept 30 year bond is up 1 tick and trading at 150.02.
Indices: The June S&P 500 emini ES contract is up 8 ticks and trading at 2080.25.
Gold: The August gold contract is trading up at 1176.00. Gold is 24 ticks higher than its close.
Initial Conclusion
This is not a correlated market. The dollar is up+ and oil is up+ which is not normal and the 30 year bond is trading up. The Financials should always correlate with the US dollar such that if the dollar is lower then bonds should follow and vice-versa. The indices are up and Crude is trading up which is not correlated. Gold is trading up which is not correlated with the US dollar trading up. I tend to believe that Gold has an inverse relationship with the US Dollar as when the US Dollar is down, Gold tends to rise in value and vice-versa. Think of it as a seesaw, when one is up the other should be down. I point this out to you to make you aware that when we dont have a correlated market, it means something is wrong. As traders you need to be aware of this and proceed with your eyes wide open.
Asia traded mainly lower with the exception of the Indian Sensex exchange which traded higher. As of this writing all of Europe is trading lower with the exception of the Milan exchange which traded fractionally higher.
Possible Challenges To Traders Today
– NFIB Small Business Index is out at 9 AM EST. This is not major.
– JOLTS Job Openings is out at 10 AM EST. This is major.
– Wholesale Inventories m/m is out at 10 AM EST. This is not major.
Currencies
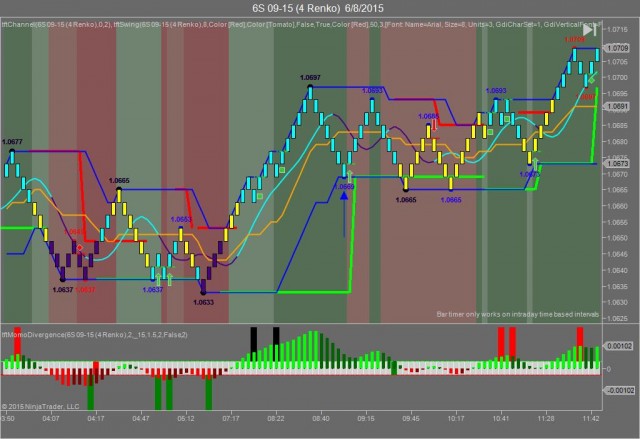
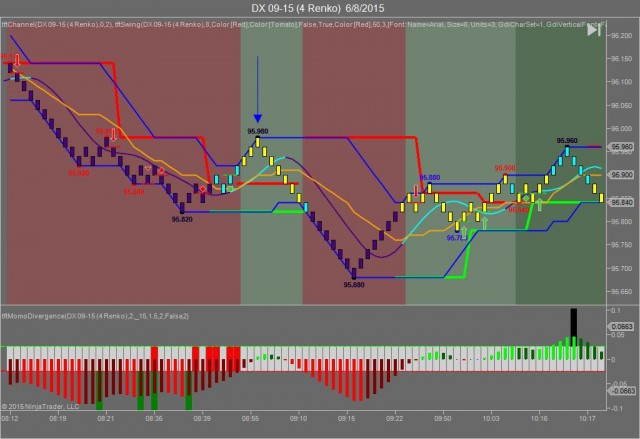
Yesterday the Swiss Franc made its move at around 9 AM EST with no real economic news in sight. The USD hit a high at around that time and the Swiss Franc hit a low. If you look at the charts below the USD gave a signal at around 9 AM EST, while the Swiss Franc also gave a signal at just about the same time. Look at the charts below and youll see a pattern for both assets. The USD hit a high at around 9 AM EST and the Swiss Franc hit a low. These charts represent the latest version of Trend Following Trades and Ive changed the timeframe to a Renko chart to display better. This represented a long opportunity on the Swiss Franc, as a trader you could have netted 20 plus ticks on this trade. We added a Donchian Channel to the charts to show the signals more clearly. Remember each tick on the Swiss Franc is equal to $12.50 versus $10.00 that we usually see for currencies. Please note that starting today we will use September as the front month for these instruments.
Charts Courtesy of Trend Following Trades built on a NinjaTrader platform
Click on an image to enlarge it.
 Swiss Franc Sept, 2015 6/8/15
 USD Sept, 2015 6/8/15
Bias
Yesterday we said our bias was neutral as the futures didnt give any clue as to direction. Today and as of this writing all instruments are pointed higher and as such there is no correlation. Given this fact we will maintain a neutral bias.
Could this change? Of Course. Remember anything can happen in a volatile market.
Commentary
Yesterday morning the futures didnt give any clue as to direction and hence our neutral bias. A neutral bias means the markets could go in any direction and thus the Dow dropped 82 points and the other indices fell as well. The significance is that the Dow is trading below the 18,000 point threshold and only time will if this continues or it rebounds. The G7 apparently has a plan to end fossil fuel in 85 years. Do we really have to wait that long? I dont think too many folks reading this will be around in 85 years.
Just so you understand, Market Correlation is Market Direction. It attempts to determine the market direction for that day and it does so by using a unique set of tools. In fact TradersLog just published an article on this subject that can be viewed at:
http://www.traderslog.com/market-cor…ket-direction/
Each day in this newsletter we provide viewers a snapshot of the Swiss Franc versus the US dollar as a way and means of capitalizing on the inverse relationship between these two assets. Futures Magazine recognized this correlation as well. So much so that they printed a story on it in their December issue. That story can be viewed at:
 View article on Futures Mag
Many of my readers have been asking me to spell out the rules of Market Correlation. Recently Futures Magazine has elected to print a story on the subject matter and I must say Im proud of the fact that they did as Im Author of that article. I encourage all viewers to read that piece as it spells out the rules of market correlation and provides charts that show how it works in action. The article is entitled How to Exploit and Profit from Market Correlation and can be viewed at:
 View article on Futures Mag
As a follow up to the first article on Market Correlation, Ive produced a second segment on this subject matter and Futures Magazine has elected to publish it. It can be viewed at:
 View article on Futures Mag
Many subscribers have asked what is the best time of day to trade? A recent article published by Futures Magazine may shed some light on the subject:
http://www.futuresmag.com/2015/01/15…orning-trading
As readers are probably aware I dont trade equities. While were on this discussion, lets define what is meant by a good earnings report. A company must exceed their prior quarters earnings per share and must provide excellent forward guidance. Any falloff between earning per share or forward guidance will not bode well for the companys shares. This is one of the reasons I dont trade equities but prefer futures. There is no earnings reports with futures and we dont have to be concerned about lawsuits, scandals, malfeasance, etc.
Anytime the market isnt correlated its giving you a clue that something isnt right and you should proceed with caution. Today our bias is neutral. Could this change? Of course. In a volatile market anything can happen. Well have to monitor and see.
As I write this the crude markets are up and the futures are trading higher. This is not normal. Crude and the markets are now reverse correlated such that when the markets are rising, crude drops and vice-versa. Yesterday July crude dropped to a low of $57.86 a barrel. It would appear at the present time that crude has support at $57.71 a barrel and resistance at $59.35. This could change. Well have to monitor and see. Remember that crude is the only commodity that is reflected immediately at the gas pump. On Monday, December 22nd OPEC reiterated their stance not to cut production. OPEC appears to be adamant about keeping production where it is as they believe that oil will rebound. What they havent figured out yet is that the more countries like Canada and the US produce their own crude (by whatever means) the more crude prices will fall. As an update to this OPEC met this past week and have continued their stance in NOT cutting production
.
If trading crude today consider doing so after 10 AM EST when the markets gives us better direction.
Future Challenges
Greece is the word? This past week weve heard rumors going back and forth that Greece will not be able to meet its next round of payments unless theyre allowed to borrow more money. The final result of this is not yet know as (besides Greece) there are 3 parties involved: The ECB, the IMF and Germany. So depending upon who you listen to at the moment, that will determine the outcome for that moment. This is insanely crazy and the markets do not like it. The oxymoron here is that the markets dont like uncertainty but the markets are the most uncertain place to put capital to work on Planet Earth. Clearly this represents an area of uncertainty that Europe doesnt like and it may transcend to other global markets (namely the US).
As an update to this story, it would appear as though the IMF and ECB have decided to extend an increase in Greeces credit line in order to allow them to pay back debt. The new government must convince its constituents that austerity is a good thing (even though they ran against that principle). This will be interesting to see how it all works out.
As an update to the update, were now hearing that Greece has balked at the terms proposed by the troika (ECB, IMF and Germany) and that talks will continue. Those talks need to happen sooner as opposed to later as Greeces repayment is due within days
Crude Oil Is Trading Higher
Crude oil is trading higher and the markets are advancing. This is not normal. Crude typically makes 3 major moves (long or short) during the course of any trading day: around 9 AM EST, 11 AM EST and 2 PM EST when the crude market closes. If crude makes major moves around those time frames, then this would suggest normal trending, if not it would suggest that something is not quite right. As always watch and monitor your order flow as anything can happen in this market. This is why monitoring order flow in todays market is crucial. We as traders are faced with numerous challenges that we didnt have a few short years ago. High Frequency Trading is one of them. Im not an advocate of scalping however in a market as volatile as this scalping is an alternative to trend trading.
Nick Mastrandrea is the author of Market Tea Leaves. Market Tea Leaves is a daily newsletter that is dedicated to your trading success. We teach and discuss market correlation. Market Tea Leaves is published daily, pre-market in the United States and can be viewed at www.markettealeaves.com. Interested in Market Correlation? Want to learn more? Signup and receive Market Tea Leaves each day prior to market open. As a subscriber, youll also receive our daily Market Bias video that is only available to subscribers.
Source: http://www.traderslog.com/forum/showthread.php?t=24484&goto=newpost


