


FOMC Day

Good Morning Traders,
As of this writing 4 AM EST, heres what we see:
US Dollar: Jun. USD is Down at 101.340.
Energies: April Crude is Up at 48.58.
Financials: The June 30 year bond is Down 3 ticks and trading at 146.24.
Indices: The June S&P 500 emini ES contract is 16 ticks Higher and trading at 2367.00.
Gold: The April gold contract is trading Up at 1202.90. Gold is 3 ticks Higher than its close.
Initial Conclusion
This is not a correlated market. The dollar is Down- and crude is Up+ which is normal and the 30 year bond is trading Lower. The Financials should always correlate with the US dollar such that if the dollar is lower then bonds should follow and vice-versa. The indices are Up and Crude is trading Up which is not correlated. Gold is trading Up which is correlated with the US dollar trading Down. I tend to believe that Gold has an inverse relationship with the US Dollar as when the US Dollar is down, Gold tends to rise in value and vice-versa. Think of it as a seesaw, when one is up the other should be down. I point this out to you to make you aware that when we dont have a correlated market, it means something is wrong. As traders you need to be aware of this and proceed with your eyes wide open.
Asia traded mixed with half the exchanges higher and the other half lower. As of this writing all of Europe is trading lower.
Possible Challenges To Traders Today
CPI is out at 8:30 AM. This is major.
Core CPI m/m is out at 8:30 AM EST. This is major.
Retail Sales is out at 8:30 AM EST. This is major.
Retail Sales m/m is out at 8:30 AM EST. This is major.
Empire State Mfg Index is out at 8:30 AM. This is major.
Business Inventories m/m is out at 10 AM EST. This is not major.
NAHB Housing Market Index is out at 10 AM EST. This is major.
Crude Oil Inventories is out at 10:30 AM. This is major.
FOMC Economic Projections is out at 2 PM EST. This is major.
FOMC Statement is out at 2PM EST. This is major.
Federal Funds Rate is out at 2 PM EST. This is major.
FOMC Press Conference starts at 2:30 PM EST. This is major.
TIC Long-Term Purchases is out at 4 PM EST. This is not major.
Treasuries
Weve elected to switch gears a bit and show correlation between the 30 year bond (ZB) and The YM futures contract. The YM contract is the DJIA and the purpose is to show reverse correlation between the two instruments. Remember its liken to a seesaw, when up goes up the other should go down and vice versa.
Yesterday the ZB made its move at around 10:30 AM with no economic news to speak of. The ZB hit a low at around that time and the YM hit a high. If you look at the charts below ZB gave a signal at around 10:30 AM and the YM was moving lower at the same time. Look at the charts below and youll see a pattern for both assets. ZB hit a low at around 10:30 AM and the YM hit a high. These charts represent the newest version of Trend Following Trades and Ive changed the timeframe to a 30 minute chart to display better. This represented a long opportunity on the 30 year bond, as a trader you could have netted about 15 ticks per contract on this trade. Each tick is worth $31.25. We added a Donchian Channel to the charts to show the signals more clearly.
Charts Courtesy of Trend Following Trades built on a NinjaTrader platform Click on an image to enlarge it.
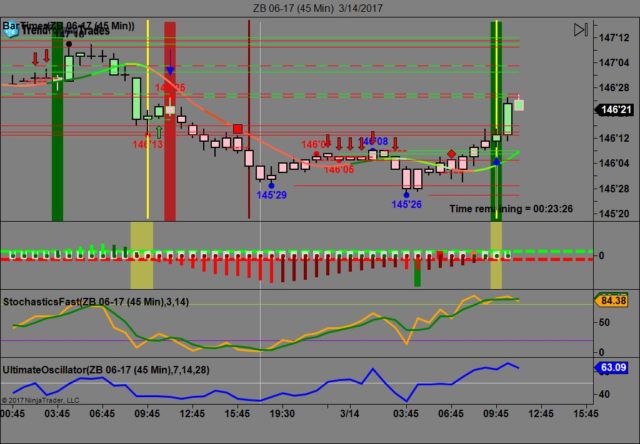 ZB June, 2017 3/14/17
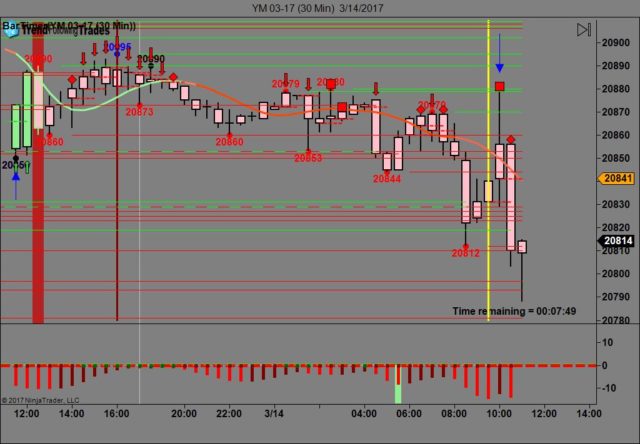 YM- March, 2017 3/14/17
Bias
Yesterday we gave the markets a neutral bias as both the Bonds and Gold were pointed lower yesterday morning but the indices were trading lower as well. Given that today is FOMC Day our bias is neutral.
Could this change? Of Course. Remember anything can happen in a volatile market.
Commentary
Yesterday the markets didnt have much of a sense of direction. The Bonds and Gold were both trading lower yesterday morning and this usually represents an upside bias however the indices were all trading lower yesterday morning hence the neutral bias. The Dow dropped 44 points and the other indices lost ground as well. Today we have 14 economic reports most of which are major as well as the Fed rate decision out at 2 PM EST.
Just so you understand, Market Correlation is Market Direction. It attempts to determine the market direction for that day and it does so by using a unique set of tools. In fact TradersLog published an article on this subject that can be viewed at: http://www.traderslog.com/market-cor…ket-direction/
Many of my readers have been asking me to spell out the rules of Market Correlation. Futures Magazine has elected to print a story on the subject matter and I must say Im proud of the fact that they did as Im Author of that article. I encourage all viewers to read that piece as it spells out the rules of market correlation and provides charts that show how it works in action. The article is entitled How to Exploit and Profit from Market Correlation and can be viewed at:
 View article on Futures Mag
As a follow up to the first article on Market Correlation, Ive produced a second segment on this subject matter and Futures Magazine has elected to publish it. It can be viewed at: View article on Futures Mag
Many subscribers have asked what is the best time of day to trade? A recent article published by Futures Magazine may shed some light on the subject: http://www.futuresmag.com/2015/01/15…orning-trading
As readers are probably aware I dont trade equities. While were on this discussion, lets define what is meant by a good earnings report. A company must exceed their prior quarters earnings per share and must provide excellent forward guidance. Any falloff between earning per share or forward guidance will not bode well for the companys shares. This is one of the reasons I dont trade equities but prefer futures. There is no earnings reports with futures and we dont have to be concerned about lawsuits, scandals, malfeasance, etc. Anytime the market isnt correlated its giving you a clue that something isnt right and you should proceed with caution. Today our bias is neutral. Could this change? Of course. In a volatile market anything can happen. Well have to monitor and see.
As I write this the crude markets are Higher and the futures are trading Higher. This is not normal. Crude and the markets are now reverse correlated such that when the markets are rising, crude drops and vice-versa. Yesterday April Crude dropped to a low of $47.09 a barrel. It would appear at the present time that crude has support at $47.00 a barrel and resistance at $49.52. This could change. Well have to monitor and see. Remember that crude is the only commodity that is reflected immediately at the gas pump. Please note that the front month for crude is now April. Last December and after two years OPEC finally decided to cut production but the price crude is still tame (as of this writing). What they havent figured out yet is that the more countries like Canada and the US produce their own crude (by whatever means) the more crude prices will fall. The move by OPEC to cut production in an attempt to pump up prices is liken to too little, too late as the world doesnt need their oil as much as they used to. Power equipment that used to need oil (Grass Trimmers, Lawn Mowers, Autos) now run on battery power and Canada and the United States are producing more of their own crude. As an update to this the non-OPEC countries have come to an agreement to unilaterally cut production across the board and this has served to temporarily raise crude prices. Well have to see if and how long this lasts
Apparently it didnt last too long as crude is now trading below the proverbial $50.00 a barrel.
If trading crude today consider doing so after 10:30 AM EST when the inventory numbers are released and the markets gives us better direction.
Future Challenges
Last Tuesday Congress previewed their solution to Obamacare which quite frankly still keeps some aspects of the ACA. The first thing that will be kept is pre-existing conditions meaning insurers cant discriminate. The second aspect that will be kept is young adults (up to age 26) can be kept on their parents plan. The subsidies as we know it will change. As we understand it now tax credits will be issued as opposed to a subsidy. In this scenario (as we understand it currently) the insured will lay out and pay the full premium without a government subsidy and at year end or tax time the insured will receive a pre-determined tax credit on their taxes. This is the most ridiculous idea Ive heard of thus far. The people who are on Obamacare are on it because they cant afford to pay a full premium (especially with the increases that the insurance companies are now charging) and need a subsidy in order to have the insurance. The only other recourse is to go on Medicaid but if you earn too much money then you arent entitled to Medicaid and by the way while on Medicaid you have no choice as to your doctors, procedure options or options of any kind. Elderly insureds will pay 5 times the amount paid by a younger member for this new and improved Obamacare or do we call it Trumpcare? Of course all of this is premature and well reveal details as they are released but this is what can happen when you have too many billionaires in government; they think everything is affordable.
As an update to this the CBO is now estimating that 14 million people will lose health insurance coverage this year and that within 10 years 24 million will be without coverage.
TradersLog has just published an article entitled So You Think You Can Trust Your Elected Officials? That article can be viewed at: http://www.traderslog.com/trust-elected-officials
Crude Oil Is Trading Higher
Crude oil is trading Higher and the markets are Higher. This is not normal. Crude typically makes 3 major moves (long or short) during the course of any trading day: around 9 AM EST, 11 AM EST and 2 PM EST when the crude market closes. If crude makes major moves around those time frames, then this would suggest normal trending, if not it would suggest that something is not quite right. As always watch and monitor your order flow as anything can happen in this market. This is why monitoring order flow in todays market is crucial. We as traders are faced with numerous challenges that we didnt have a few short years ago. High Frequency Trading is one of them. Im not an advocate of scalping however in a market as volatile as this scalping is an alternative to trend trading. Remember that without knowledge of order flow we as traders are risking our hard earned capital and the Smart Money will have no issue taking it from us. Regardless of whatever platform you use for trading purposes you need to make sure its monitoring order flow. Sceeto does an excellent job at this. To fully capitalize on this newsletter it is important that the reader understand how the various market correlate. More on this in subsequent editions.
Nick Mastrandrea is the author of Market Tea Leaves. Market Tea Leaves is a daily newsletter that is dedicated to your trading success. We teach and discuss market correlation. Market Tea Leaves is published daily, pre-market in the United States and can be viewed at www.markettealeaves.com. Interested in Market Correlation? Want to learn more? Signup and receive Market Tea Leaves each day prior to market open. As a subscriber, youll also receive our daily Market Bias video that is only available to subscribers.
Source: http://www.traderslog.com/forum/showthread.php?t=25509&goto=newpost
