
| Online: | |
| Visits: | |
| Stories: |

| Story Views | |
| Now: | |
| Last Hour: | |
| Last 24 Hours: | |
| Total: | |
Overcoming Bias
BarroMetrics Views: Overcoming Bias
I was asked to give an example of overcoming bias, especially confirmation bias. I’m happy to oblige.
Let’s look at the GBPUSD.
You’ll recall that some readers (and I) made good money anticipating Brexit (see BarroMetrics Views: Brexit, A Trade Post Morterm).
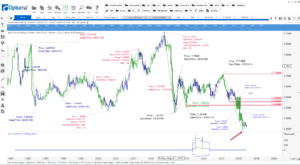
After the ‘flash crash’ (red arrow, Figure 2), I decided to take the pair off my radar until the effects of the crash had dissipated. I felt that the move had not only taken out all the stops that would have provided some directional move (around the 1.3000 level), it also meant that the GBPUSD would need time to digest the volatility.
That was over five months ago, time enough for the effects to be forgotten. So recently, I placed the pair back on my watch list. When I do that, the first thing I do is the answers to two questions:
- What is the trend of my trader’s timeframe (18-day swing representing the monthly trend)?
- Is it likely to continue or change?
The answers provide me with my strategy (go long or short or stand aside). And, my first step to clarify the strategy is to review my long-term and 12-month swing charts.
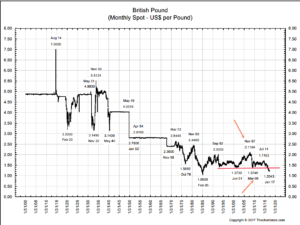
Figure 1 is a long-term monthly chart going back to 1900. I suspect it is a spot monthly of the futures market because the prices and dates of swing highs and swing lows don’t quite match up with the FX data. Nevertheless, the chart is useful for perspective.
Notice from the chart:
- There was a sideways market starting in Sept 1992.
- Last year the GBPUSD broke out from the 25-year old congestion pattern last year.
- The sideways pattern was the Value Area of a larger swing high (Nov 80) and low (Feb 85). Market Profile theory suggests that we should have seen an upside breakout (i.e. above Nov 07 high). The fact we broke down suggests a move to at least the Feb 85 low and probably a break below it.
- We saw a similar idea in action with the upside failure breakout in Nov 07. The breakout ought to have fueled a move to the Nov 80 high. When it did not, we could say that was a high probability we’d see the Jun 01 and Mar 00 lows and probably their breach – the downside breach is what we saw in 2016.
Figure 2 shows the congestion pattern displayed with my FX data from MarketAnalyst
- I have marked the swing highs, and lows, with a tool MA calls Time Price Labels (TPLs).
- The two green rectangles identify what I call FTPs – possible areas of resistance and more: prices on corrections tend to be drawn to these zones more than they are to spike highs and spike lows.
The two charts provide the background, the context, to my trader’s timeframe (18-day swing line representing the monthly trend).
My conclusions are that the trend will probably be down, and likely to continue: a downtrend established by a break below a 25-year old pattern does not reverse in 12-months.
My conclusions also form my bias.
More tomorrow.
FIGURE 1 Long-Term Chart GBPUSD
Chart through the courtesy of ChartStore
FIGURE 2 12-M Swing GBPUSD
Chart through the courtesy of MarketAnalyst
The post Overcoming Bias appeared first on Ray Barros' Blog for Trading Success.
Source: http://www.tradingsuccess.com/blog/overcoming-bias-4679.html


