


| Story Views | |
| Now: | |
| Last Hour: | |
| Last 24 Hours: | |
| Total: | |
Small Cap Value Report (Thu 16 Mar 2017) – TFW, SAA, SEE

Good morning!
Many thanks to Graham for really excellent amp; insightful reports this week.
Today I’ll be covering results from;
FW Thorpe (LON:TFW)
Mamp;C Saatchi (LON:SAA)
Seeing Machines (LON:SEE)
Also, I’m hoping to catch up on a few other things from earlier this week.
FW Thorpe (LON:TFW)
Share price: 323p (pre market open)
No. shares: 115.7m
Market cap: £373.7m
Interim results – for the 6 months to 31 Dec 2016.
This is a group of lighting companies. It’s essentially a family controlled company, with a stock market listing. There’s nothing wrong with that, indeed some investors (such as Lord Lee, and David Stredder) seek out such companies – appreciating their long-term thinking, and prudence.
The headline figures for H1 certainly look good;
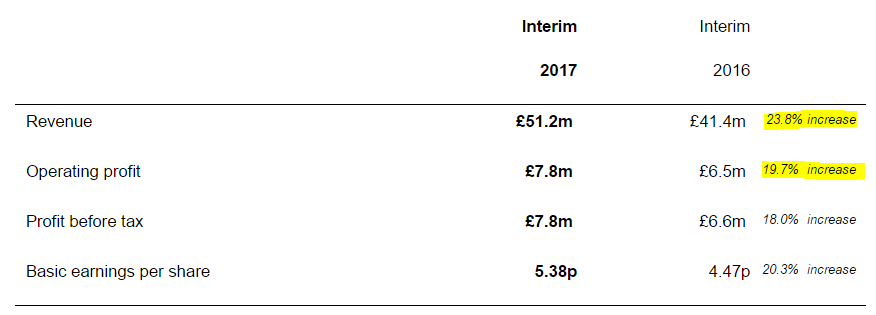
Note that when profit rises by a smaller percentage than revenue, that’s a quick way of noting that the profit margin has reduced. Dividing operating profit into revenue confirms this – the operating margin was 15.7% last year in H1, and has dropped a little to 15.2% this year in H1.
The narrative explains that this is due to overtime payments;
Whilst normally expecting a higher level of profit attainment on raised revenues the exceptionally buoyant first half at our largest entity, Thorlux Lighting, had to be met by the imposition of high levels of overtime, shift working etc. which inevitably has led to a higher cost of production than we would have liked.
These actions were necessary to satisfy spikes in customer demand but it is unlikely that the need for such levels of activity will persist.
Any problems caused by buoyant customer demand, are quite nice problems to have, in my view. Although the last sentence seems to be suggesting lower customer demand in future, which is a concern.
Thorlux is by the most profitable part of the group, as you can see from the segmental analysis in note 2 of today’s interim results. It made £5.9m of the £7.8m total operating profit.
Seasonality – looking back as last year’s numbers, H2 seems to be a good bit stronger than H1. If the same sort of pattern plays out this year, then it looks as if the company might deliver perhaps 12-14p EPS.
I can’t find any broker research on the company at the moment, but have put in a request to my broker, so will update this later if anything comes through.
Outlook – “satisfactory overall result for the year” is the same wording that was used at the AGM update in Nov 2016, and is used again today;
We remain optimistic of a satisfactory overall result for the year.
This company seems to be open amp; honest in its trading updates amp; results narrative – giving both positive and negative points, making them a pleasure to read. It’s good to know that management can relied on, and are not trying to hide areas of under-performance, unlike many other companies.
Balance sheet – wonderful, as always.
This includes net cash of £35.8m. The overall working capital position is a surplus of £56.7m (i.e. current assets, minus current liabilities). That’s a current ratio of 4.25 (where anything over about 1.5 is strong!)
Why does this matter? Well, it means the company won’t be going bust. Also, it means there is cash ready amp; waiting to buy up any suitable acquisitions – which would boost earnings of course. Therefore this balance sheet strength should be factored into how we value the company.
Valuation – tricky, as whilst I like this company very much, it’s become very expensive on a PER basis (which is the sensible way to value a fairly mature company like this).
Even if we’re optimistic, and assume it might deliver 14p for the full year to 6/2017, then at 323p share price, the PER is just over 23 times.
If we take off say 10% of the market cap to allow for the surplus cash, then that would bring the PER down to 20.8 times – which looks a full valuation.
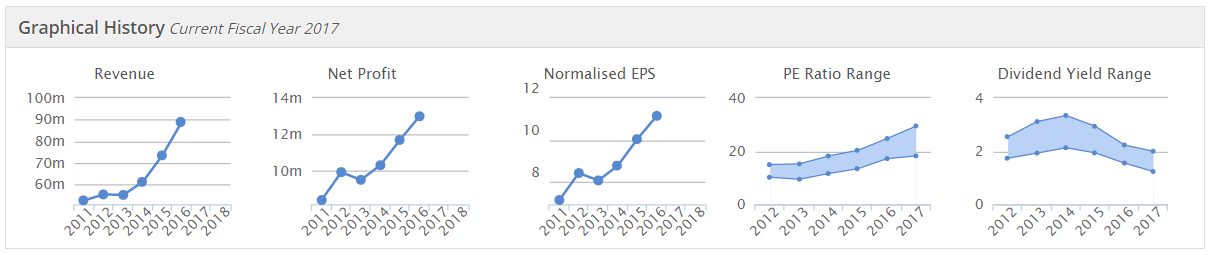
My opinion – I very much like the company, and acknowledge that it is trading well, and delivering decent growth. However, that very much looks already baked into the valuation – so where is the upside going to come from? Also, what happens if growth slows in H2? I think you’d need to be very confident about the future, to be willing to pay the current price, or to continue holding. That said, the company’s done well in the past, so it may well continue to do so.
The Stockopedia historical graphs neatly encapsulate the situation (see below). So excellent growth in revenue amp; profit has driven an increasingly high PER.
Mamp;C Saatchi (LON:SAA)
Share price: 353p (unchanged today)
No. shares: 75.7m
Market cap: £267.2m
Final results – for the year ended 31 Dec 2016.
You always have to be so careful when looking at the accounts of PR companies. After all, embellishing the truth (to put it politely) is their business, and I find that usually carries through into their accounting too!
The headline figures here look excellent, e.g. operating profit up 24% to £23.0m.
However, the statutory figures don’t look anything like the highlighted figures, e.g. profit before tax is shown on the face of the Pamp;L as being down 46% to £6.8m.
Note 3 is the key place to look. This gives a reconciliation between statutory, and adjusted profit. The table is too big to copy here, but it contains 6 categories of adjustments. The one I have the biggest problem with, is a column called “Put option accounting”. This is by far the biggest adjustment, adding £8.6m profit. It has an asterisk next to it, which says;
These values represent share based payment charges (£7,997k) and fair value adjustments to minority put option liabilities (£597k), the non-controlling interest charge is the additional charge had the put option not been accounted for under IFRS2 conditional share awards.
To my mind, if £8.0m is share based payment charges, and £0.6m is put option costs, then surely the column heading should be called “Share based payment charges”, and not “Put option accounting”?
My view is that, in a people business like this, share based payments are just part of employee/Director remuneration. So to adjust out those costs, and pretend they don’t exist, seems to me to overstate the real level of profits. I suppose these payments might be earn-outs for acquisitions? It’s all far too convoluted for my liking anyway.
My general feeling is that the more adjustments there are to accounts, then the higher the risk that we’re having the wool pulled over our eyes.
Balance sheet – this looks very odd to me. There are some hefty liabilities called “minority shareholder put option liabilities”, which add up to £33.2m. Plus another item called “other financial liabilities” which adds up to about £32m (2 figures need to be added together).
Overall, the balance sheet is negative, when you get rid of intangibles. The working capital position isn’t great either. That’s not necessarily a problem, if the timing of money flowing in is more favourable than money out, but it’s still worth noting.
Outlook – hardly surprising that a PR company sounds upbeat, but for what it’s worth, it does;
2016 was an outstanding year for Mamp;C Saatchi. We continue to roll out our proven strategy of winning new business and starting new businesses and see positive momentum across our global network and business channels. The year has started well and we are confident that we will continue to make good progress in 2017 and beyond.
My opinion – I don’t like these accounts at all. There are too many adjustments, and the share based payment charge that is buried in the notes looks very large.
Shareholders get a dividend yield of 2.3% based on the 2016 payout.
On a positive note, the top line growth looks good, with significant growth being reported in some territories.
For me personally, if I don’t trust the accounts, then I don’t buy the shares. This one fits into that category for me.
Seeing Machines (LON:SEE)
Share price: 3.7p (down 9.7% today)
No. shares: 1,486.5m
Market cap: £55.0m
Half year results – 6 months to 31 Dec 2016.
There’s no getting away from the fact that these figures look grim. The company reports in Aussie dollars, a few key numbers for H1;
Revenue A$3.6m (prior year comparative of A$29.3m was a one-off, due to sale of rights to Caterpillar)
Loss before tax of A$14.1m (this is just for 6 months, remember)
Net cash of A$11.6m looks alarmingly low, however the company has raised more cash since the 31 Dec 2016 interim period end.
Fundraising – of about £16.4m was done in Jan 2017, which is about A$26.1m, less a chunk for costs.
If the company continues to rack up such big losses, then it’s likely to deplete the enlarged cash pile fairly rapidly. There looks to be enough fuel in the tank for 2017 and into 2018 anyway.
Revenues from the fleet sector look to be disappointingly low, and slow to materialise.
My opinion – the fleet and automotive sectors look promising, e.g. 60 trials underway with haulage companies. There’s no doubt the product works too – as it’s tried amp; tested in the mining sector.
Therefore, owning this share is a leap of faith, hoping that the company will generate enough sales momentum in future to justify the current valuation. If sales really start to take off, then I imagine bullish forecasts are likely to excite investors, and see the valuation potentially roar upwards.
If sales remain in the doldrums, and cash burn continues at the present rather alarming rate, then yet another fundraising in 2018 would be on the cards.
I don’t have a crystal ball, so have no idea how things will pan out. Personally, I don’t really touch stuff like this any more (because shares like this usually generate losses). There needs to be a viable business model in place already for me to be interested. So with this company, I’d rather pay more, once the business model is proven, than jump in now whilst it’s unproven, and shoulder the risk of it all falling flat.
Source: http://www.stockopedia.com/content/small-cap-value-report-thu-16-mar-2017-tfw-saa-see-175887/
