
| Online: | |
| Visits: | |
| Stories: |

| Story Views | |
| Now: | |
| Last Hour: | |
| Last 24 Hours: | |
| Total: | |
SPY Chart – April 7, 2017 – S&P 500
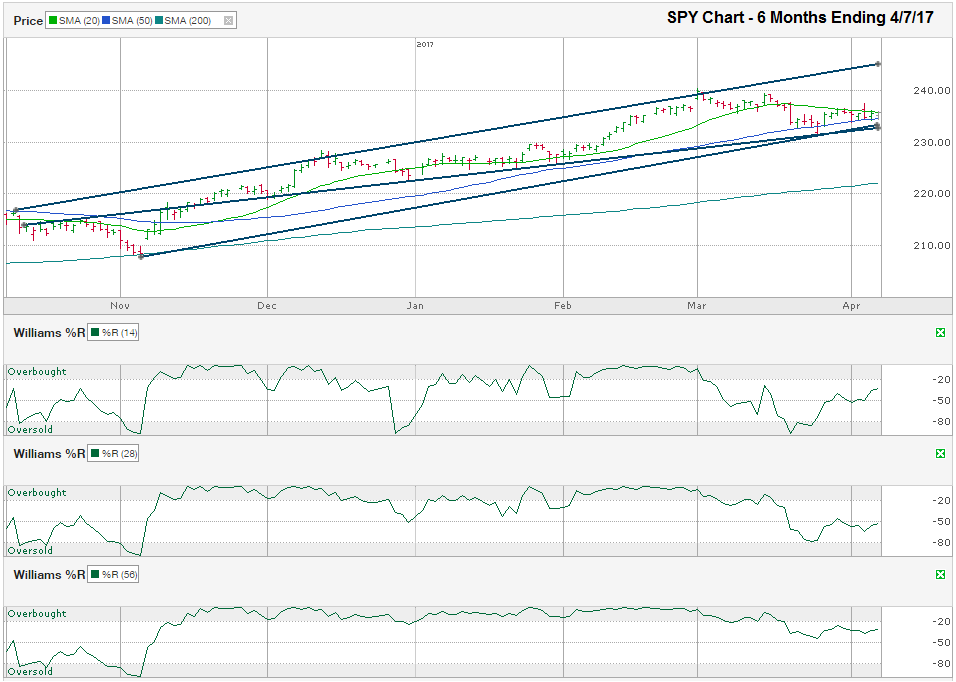
The chart below shows the daily prices for the past six months on SPY, the SPDR ETF that tracks the S&P 500 Index, after closing the week at $235.20, on April 7, 2017.
The S&P 500 has edged lower since peaking at the beginning of March, but the chart shows it hasn’t rolled over yet. The two trend lines that mark SPY’s higher lows converged at the intraday low on March 27, but both still maintain support from further lows. The longest trend line drawn below marks the trend of higher lows. The area between these sets of lines is called the trading channel and projects where SPY is likely to trade, until it breaks outside of either barrier.
Other technical indicators can help predict future movement too. The moving averages indicate directional patterns that help to highlight changes in sentiment. An index that falls below its moving average tends to fall further below it until a new catalyst or technical barrier influences its direction. I used the 20, 50, and 200-day moving averages in this chart to highlight a few different points. The 20-day moving average has broken support, meaning it is no longer a barrier to downside price movement, but instead has become a resistance to the upside. At the same time, the 50-day moving average has only broken support once since early November. That break came intraday on March 27, but SPY recovered before the close and moved higher over the following week.
As the 20-day and 50-day moving averages draw in closer to each other, one will break support or resistance and will likely lead to a few weeks of trading in the direction that “wins”. If the direction is higher, SPY could trade up to its upper trend line, close to $243-244. If SPY closes below its 50-day moving average for two straight days and that drop coincides with a move below its trend lines of higher lows, the next stop could be the 200-day moving average, currently around $222 and ascending. A drop to the 200-day moving average would be approximately 7.5% below the intraday high reached on March 1 and about 5.5% below Friday’s close. A price decline of 5.0% to 7.5% should be enough to shake out the investors who spook easily and open the door to a new leg to the bull market.
The Williams %R technical indicator can be used as a strong predictor when the signals align. When the 14, 28, and 56-day indicators offer buy or sell signals weeks apart, as they did in March, the reliability of Williams %R decreases substantially. It’s worth keeping an eye on these three time frames for when they regroup. In this chart, the 14-day indicator fell below the overbought range at the beginning of March, foreshadowing more selling was to come, but the 28 and 56-day indicators didn’t follow suit until mid-month when most of the selling had already run its course. While the 14-day indicator fell close to the bottom of the oversold area, the other two did not. This lack of conviction in the combined indicators leaves technicians in a wait and see position, just as we are waiting to see which direction takes command above the 20-day moving average or below the 50-day moving average.
Much like value investors recently, investors who rely on charts to help make their trading decisions are being forced to be patient and wait for a better buying or selling opportunity when the data changes. After such a long run without much of a decline, stocks need a new catalyst for change or an extended period of consolidation. The S&P 500 has been in a consolidation phase for the past seven weeks and could use twice that long, if not longer, to allow the 200-day moving average to draw in closer and earnings to improve and help the broader market’s P/E ratio.
Source: http://mytradersjournal.com/stock-options/2017/04/08/spy-chart-april-7-2017/


