
| Online: | |
| Visits: | |
| Stories: |

| Story Views | |
| Now: | |
| Last Hour: | |
| Last 24 Hours: | |
| Total: | |
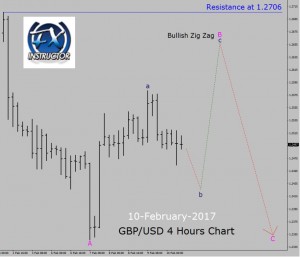
Down trend in GBP/USD 4 hours chart
 Trend is bearish in four hours time frame. Critical resistance level is present at 1.2706 price area. As forecasted, bullish trend has finally changed into a bearish trend. In last few trading hours, price action has showed some signs of buying pressure. In my judgement, price is going to print a Bullish Wave B Zig Zag pattern in a down trend which offers a sell trading chance.
So, wait out of the market and allow the price action to first complete the Bullish Wave B Zig Zag smaller legs and then look for a possible sell trade to ride, up-coming Bearish Wave C leg.
However; a bullish break out in price action above 1.2706 critical resistance level will end the down trend. In such market scenario I might like to quit trading GBP/USD currency pair and redo 4 hours chart analysis.
Source: http://fxinstructor.com/blog/down-trend-in-gbpusd-4-hours-chart-3


