
| Online: | |
| Visits: | |
| Stories: |

| Story Views | |
| Now: | |
| Last Hour: | |
| Last 24 Hours: | |
| Total: | |
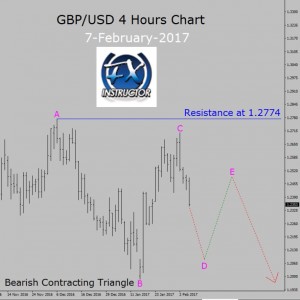
GBP/USD – Bearish Contracting Triangle in 4 Hour Chart
 Trend is bearish in GBP/USD currency pair, four hour time frame. As I have suggested past week during my daily Live trading room session, market is falling down on a short term basis to complete possible sideways looking Bearish Contracting Triangle Elliott Wave pattern and traders should look for a sell trade. So, all those Forex traders who have followed the analysis have made the right decision as the price has descended. Strong key resistance level is present at 1.2774 price level.
Be sure to check out daily Forex market updates via Live Trading Room. In my opinion, price action in GBP/USD is most probably going to drop more towards 1.2085 price area to complete Bearish Wave D leg. So a good idea is to short the market and ride the Bearish Wave D leg!
However; if price action of GBP/USD currency pair closes a bullish candlestick above 1.2774 key resistance level then bearish Elliott Wave count will become in-valid. Henceforth, I may jump at the chance to stay out of the market and re-analyze the GBP/USD price action.
Source: http://fxinstructor.com/blog/gbpusd-bearish-contracting-triangle-in-4-hour-chart


