
| Online: | |
| Visits: | |
| Stories: |

| Story Views | |
| Now: | |
| Last Hour: | |
| Last 24 Hours: | |
| Total: | |
NZD/USD – Up Trend in 4 hours chart
Wednesday, February 8, 2017 16:09
% of readers think this story is Fact. Add your two cents.
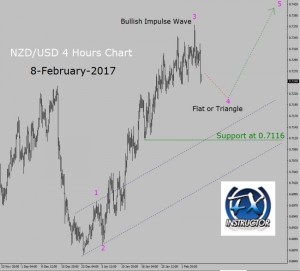
 Trend is bullish in four hours chart. Key support level is present at 0.7116 price level. In past few trading days, price has printed a possible Bullish Impulse Wave 3 pattern. Bullish Wave 3 looks completed and now price is moving down to print a Bullish Triangle or Flat pattern at Wave 4 location.
A good idea is to look for a buy trading chance and join an up trend at Wave 4 termination point. If bearish candlestick closes below 0.7116 vital support level then up trend is going to fail. In such case, I would prefer to stay out of the market and re-analyze the price action in NZD/USD currency pair.
Source: http://fxinstructor.com/blog/nzdusd-up-trend-in-4-hours-chart-2


