
| Online: | |
| Visits: | |
| Stories: |

| Story Views | |
| Now: | |
| Last Hour: | |
| Last 24 Hours: | |
| Total: | |
USD/JPY – Up trend in 4 hours chart
Monday, February 20, 2017 13:16
% of readers think this story is Fact. Add your two cents.
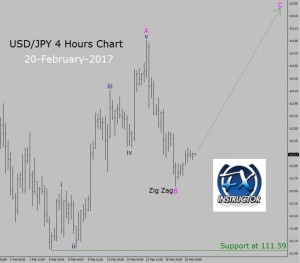
 Trend is bullish in 4 hours time frame. Vital support is present at 111.59 price level. In last few trading days, price action in USD/JPY currency pair has moved up and printed a top. In my judgement, Bullish Wave A has completed and current falling price action is probably going to be a Bearish Wave B Zig Zag Elliott Wave pattern.
This means, bearish pull back in price action which offers a buy trading chance. As the trend is still up, we could look for a buy trading opportunity at bearish Wave B termination point. However; price should stay above 111.59 support level or bullish Elliott Wave count will become in-valid. In such case, I will stay out of the market and re-analyze the price action in 4 hours chart of USD/JPY currency pair.
Source: http://fxinstructor.com/blog/usdjpy-up-trend-in-4-hours-chart-3


I think short is the best way for this pair as per now, It’s tough to say whether it will pick up or not, but the trend is hinting downwards only, so I guess it will be better to go for shorts. However, we just need to make sure we trade with proper plan and have right level of money management, as that is something that will help us a lot. I find it pretty easy with OctaFX broker since they have 50% bonus on deposit that I can use and helps me out greatly.