
| Online: | |
| Visits: | |
| Stories: |

| Story Views | |
| Now: | |
| Last Hour: | |
| Last 24 Hours: | |
| Total: | |
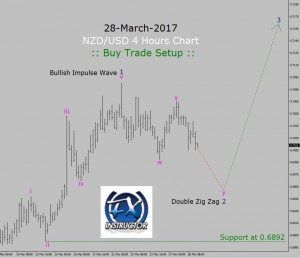
Buy setup in NZD/USD 4 Hours chart
 Trend is bullish in NZD/USD currency pair, four hour time frame. As I have suggested past week during my daily Live trading room session, market is falling down to complete a bearish Elliott wave y leg and traders should look for a sell trade. So, all those Forex traders who have followed my Elliott wave analysis have made the right decision as the price action has descended. Strong key support level is present at 0.6892 price level.
Be sure to check out daily Forex market updates via Live Trading Room. In my opinion, price action in NZD/USD currency pair is most probably going to drop more towards 0.6945 price area to print a bearish wave y leg which is going to complete Double Zig Zag Wave 2 leg. So, a good idea is to go long at or around 0.6945 market level to ride and trade the upcoming bullish Impulse wave 3 Elliott wave pattern.
However; if price action of NZD/USD currency pair closes a bearish candlestick below 0.6892, key support level then bullish Elliott wave count will become in-valid. In this case, I would prefer to stop trading the NZD/USD currency pair and re-look at the four hour chart.
Source: http://fxinstructor.com/blog/buy-setup-in-nzdusd-4-hours-chart


