
| Online: | |
| Visits: | |
| Stories: |

| Story Views | |
| Now: | |
| Last Hour: | |
| Last 24 Hours: | |
| Total: | |
Down trend in NZD/USD 4 hours chart
Tuesday, March 7, 2017 15:09
% of readers think this story is Fact. Add your two cents.
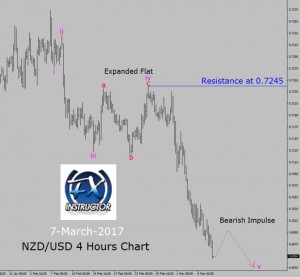
 Trend is bearish in four hours chart. Important resistance level is present at 0.7245 price level. In past few trading days, market has moved lower. A clear bearish Expanded Flat Elliott Wave pattern has appeared at Wave iv location which pushed the price down.
A good option is to look for a sell trade as price is already falling down to print a Bearish Impulse Wave v leg. If bullish candlestick closes above 0.7245 key resistance level then down trend is going to fail. In such case, I would prefer to stay out of market and re-analyze the price action in NZD/USD currency pair.
Source: http://fxinstructor.com/blog/down-trend-in-nzdusd-4-hours-chart


