
| Online: | |
| Visits: | |
| Stories: |

| Story Views | |
| Now: | |
| Last Hour: | |
| Last 24 Hours: | |
| Total: | |
GBP/USD – Down trend in 4 hours chart
Thursday, March 9, 2017 12:17
% of readers think this story is Fact. Add your two cents.
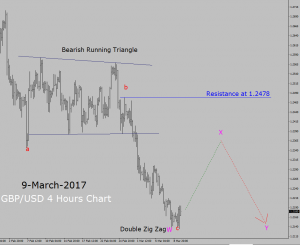
 Trend is bearish in four hours time frame. Critical resistance level is present at 1.2478 price area. As forecasted, price action resumed the down trend after printing a Bearish Running Triangle pattern. In last few trading hours, market is trying to move up.
To me; it looks like a a brilliant thought to wait for a bullish Wave X pull back and then take a sell trade to ride upcoming Bearish Wave Y leg. However; a bullish break out in price action above 1.2478 key resistance level will end the down trend. In such market scenario I might like to quit trading GBP/USD currency pair and redo 4 hours chart analysis.
Source: http://fxinstructor.com/blog/gbpusd-down-trend-in-4-hours-chart-2


