


| Story Views | |
| Now: | |
| Last Hour: | |
| Last 24 Hours: | |
| Total: | |
Gold (and silver) Is Getting Ready For Big Move

The bottom line here is that these large, well-financed entities are now anticipating inflation for the foreseeable future. This means the ‘risk on’ trade is back in vogue, and we should see higher prices for gold and silver going forward. I would also add that there is a great deal of money on the sidelines and this means we will see some violent action as these markets move to the upside - Dan Norcini from King World News LINK
The price of gold has been in a massive consolidation phase for about a year. With or without help from another round of QE, the world’s oldest currency is “coiling” for another cyclical gold bull market move higher. Here is a weekly 3-yr chart of gold with RSI and MACD “momentum indicators:
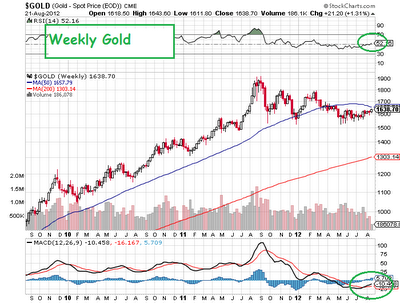
I’ve circled the RSI and MACD indicators in green. I like using a weekly chart to analyze longer term trends. Using a weekly time frame amplifies the significance of trading indicator signals, which makes the fact that both the RSI and MACD are turning up from inordinately oversold levels even more bullish. The price-action on this chart shows the massive line of support that has formed just below $1600. Fundamentally this makes sense given the numerous accounts of large-scale Central Bank buying whenever the Comex manipulators have tried to take gold below $1600 during the past 6 months.
This next chart shows the rolling 12-month “rolling” rate of return on gold in terms of its standard deviation from its mean (average) 12-month “rolling” rate of return. Without having to bend your mind around what that exactly means, think of it as the amount by which the most current 12-month trailing rate of return is either above or below it’s average rate of return for the period:
This chart, which I sourced from HERE shows that each time that the calculated metric goes 2 standard deviations (green circles) below its mean, it represents an incredibly powerful buy-signal. Again, you can look at a chart for comparison purposes, but in the previous two instances where this occurred, gold began a move up to new all-time nominal highs (as opposed to inflation-adjusted since 1980). Given the fundamentals we all know about, I see no reason why that won’t occur this time.
Here’s another aspect that hasn’t been a factor at all during the 11-yr gold bull: PRICE INFLATION
As you might expect, I have a chart that shows the potential for some serious price inflation to kick in. This is from Dan Norcini’s KWN interview linked above:
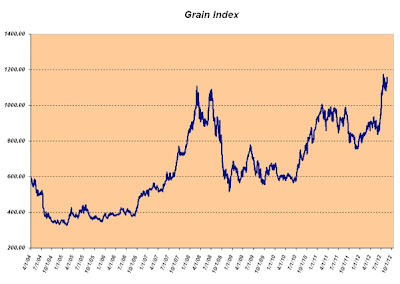
In Dan’s words: “Take a look at my Grain Composite Index – if you thought grain prices were high back at the peak of the commodity bubble in 2008, you haven’t seen anything yet! The Index is now firmly above 2008 high.”
Interestingly, I have not seen it discussed, but gold has done what it’s done over the past 11 years without any real fear of price inflation. Obviously money supply inflation/dollar devaluation has been the key driver. But big institutional investors and retail investors measure “inflation” mostly using the Government’s CPI index. At some point the fundamentals underlying the chart above plus the rampant historical and impending money supply explosion will trigger massive price inflation. That’s when the action in gold will get really interesting.
Finally, based on the large spec/commercial long/short positioning on the Comex, per the weekly COT reports, technically gold is set-up for another massive inflow of hedge fund money. I think there’s a good chance we’ll see this in the next few months, especially once the Fed caves in on more QE – which it will.
From both a fundamental and technical standpoint, the indicators for gold to make a run to new highs have not been this bullish in the 11-year bull market. Since we’ve been missing widespread big institutional and retail participation, if those two investing constituencies get involved, the coming move higher in gold may take all of us by surprise.
2012-08-22 21:55:28
Source: http://truthingold.blogspot.com/2012/08/gold-and-silver-is-getting-ready-for.html
Source:
