


| Story Views | |
| Now: | |
| Last Hour: | |
| Last 24 Hours: | |
| Total: | |
Silver: Weekly chart.
Monday, December 3, 2012 4:50
% of readers think this story is Fact. Add your two cents.

A good friend reminded me that since I am looking to hold silver long term with a crisis mentality, I should be looking at the weekly chart. Indeed!
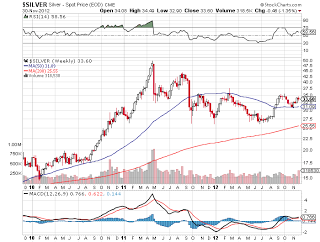
200w MA is rising relentlessly and is at US$25.55 an ounce. The 50w MA is at US$31.09 an ounce. We are seeing higher lows and higher highs on the MACD, a pure price momentum oscillator. Long term momentum is positive and strengthening.
There is a chance that supports could be tested which would probably see strong buying interest.
2012-12-03 04:41:25
Source: http://investgoldsilver.blogspot.com/2012/12/silver-weekly-chart.html
Source:
