| Online: | |
| Visits: | |
| Stories: |

| Story Views | |
| Now: | |
| Last Hour: | |
| Last 24 Hours: | |
| Total: | |
The evolution of low wage America: The most common jobs by state in 1978 to 2014. The destruction of the manufacturing industry.
mybudget360.com / by mybudget360 / February 6, 2015
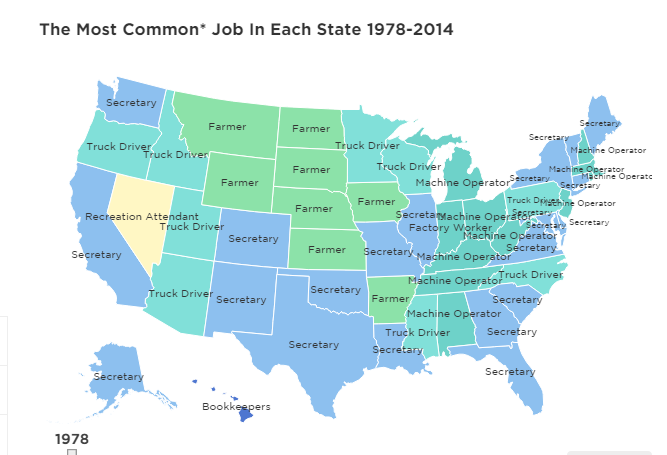
The US continues to see a widening gap between the army of low wage workers, the highly paid small upper-class, and a dwindling middle class. We’ve already shown through IRS tax data that households make a lot less than people think. The US has been on a very steady trend towards having a massive pool of low wage labor with nearly non-existent fringe benefits. Benefits have been decreasing while the cost of healthcare and planning for retirement is surging. It is always interesting to look at Census and BLS data for employment figures. There was a fascinating report looking at the most common jobs per state over time, starting in 1978. The evolution is interesting and what we can take from the report is that the secretarial position went from being very common to being virtually non-existent. And today, truck drivers are the most common job in many states thanks to the obvious reality that you can’t outsource a big rig trucker driver (although I’m sure driverless technology will soon handle that in a few years).
The most common jobs by state
There seems to be a few overarching themes to the data:
-Dominance of truck drivers (hard to outsource)
-Rise and fall of secretaries (the personal computer has been a big push here)
-Fewer farmers
Take a look at these maps between 1978 and 2014:
The post The evolution of low wage America: The most common jobs by state in 1978 to 2014. The destruction of the manufacturing industry. appeared first on Silver For The People.
Source: http://silveristhenew.com/2015/02/08/the-evolution-of-low-wage-america-the-most-common-jobs-by-state-in-1978-to-2014-the-destruction-of-the-manufacturing-industry/


