

| Online: | |
| Visits: | |
| Stories: |

| Story Views | |
| Now: | |
| Last Hour: | |
| Last 24 Hours: | |
| Total: | |
Key Global Equity Index Has Fallen Off The Precipice

On September 8, we posted a chart showing how a key worldwide equity index – the Global Dow – was “hanging on the precipice”. To refresh, the Global Dow is an equally-weighted index of the world’s 150 largest stocks. Therefore, while it may not directly be the target of a lot of money changing hands, it most certainly represents the stocks that see the most money trading hands. Thus, The Global Dow is a fairly important barometer of the state of the global large cap equity market.
The “precipice” that we referenced in the September 8 post was the UP trendline from the bull market bottom in 2009. Not surprisingly, the index did attempt to climb up off of the precipice in the weeks following the post. However, as we suggested, “another test of the precipice here at 2280 would not be surprising”. The Global Dow did return to test that area and is now officially off of the precipice – having fallen down off of it in the last few days, as the following charts illustrate.
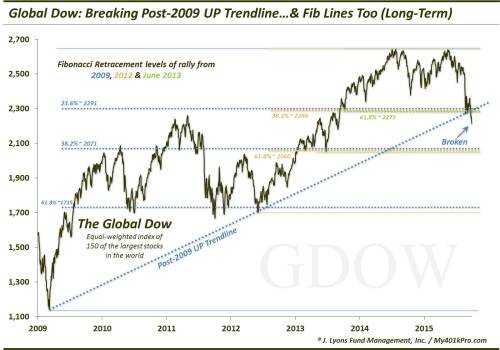
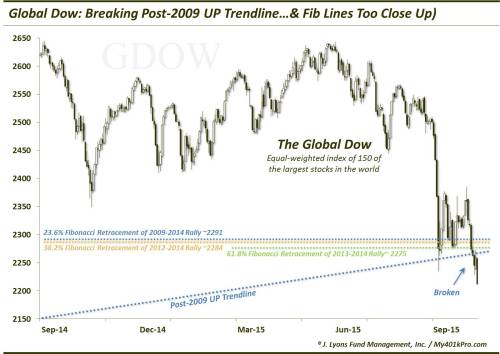
Additionally, as the charts indicate, the post-2009 UP trendline also coincided with a cluster of important Fibonacci Retracement levels shown below. Therefore, this breakdown wasn’t just about the trendline but a myriad of significant levels, making it even more consequential.
- The 23.6% Fibonacci Retracement of the 2009-2014 Rally ~2291
- The 38.2% Fibonacci Retracement of the 2011-2014 Rally ~2284
- The 61.8% Fibonacci Retracement of the June 2013-2014 Rally ~2275
So what is the practical significance of this breakdown? In the immediate-term it opens up more downside as we wrote in the September 8 post:
Should the Global Dow fail to hang on the precipice here, the next major level of logical support would come in at the next sequence of Fibonacci Retracement levels in the 2050-2070 area, or another 10% lower.
However, more significant is the fact that this is one more in a rapidly growing list of examples of indexes around the globe that are breaking long-term UP trendlines and other significant levels of various magnitude. Each and every day, we are witnessing the ongoing global selloff inflict more and more damage to the post-2009 cyclical bull market. And while that bull may not be declared dead for some time, it is now being wounded enough daily to warrant very seriously considering that possibility.
* * *
More from Dana Lyons, JLFMI and My401kPro.

![]()
Source: http://silveristhenew.com/2015/10/01/key-global-equity-index-has-fallen-off-the-precipice/
