

| Online: | |
| Visits: | |
| Stories: |

| Story Views | |
| Now: | |
| Last Hour: | |
| Last 24 Hours: | |
| Total: | |
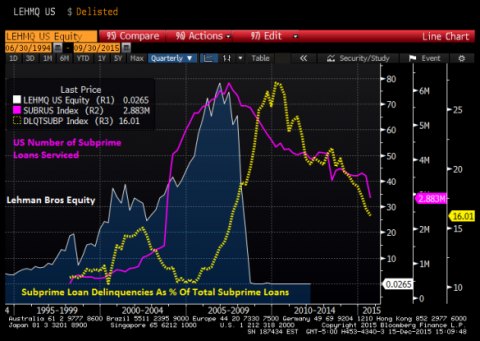
The Big Short In One Chart!!
Tuesday, December 15, 2015 23:56
% of readers think this story is Fact. Add your two cents.

wallstreetexaminer.com / by Anthony B. Sanders •
In case you go to see The Big Short when it opens on December 22nd and are confused by Brad Pitt, Steve Carell, Ryan Gosling and Christian Bale attempting to explain the collateraized debt obligation (CDO) rise and fall in the during the last decade, here is one chart that pretty much explains it all.
Lehman Brothers equity began falling in 2007 and didn’t stop. The primary cause? Subprime lending and securitization through collateralized debt obligations (CDOs).
The post The Big Short In One Chart!! appeared first on Silver For The People.
Source: http://silveristhenew.com/2015/12/15/the-big-short-in-one-chart/
