


Did We Learn from the Great Recession?

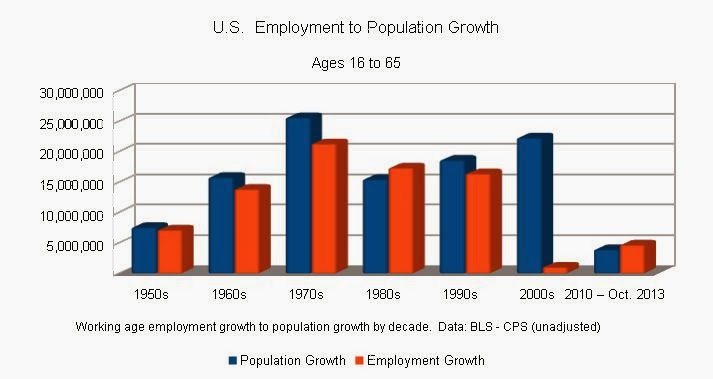
Ultimately, the salary requirement necessary to service housing obligations inflated beyond globally competitive levels and with the job creation engine already in distress, millions were laid-off. In the aftermath, working-age (16 to 65) employment levels for the first decade of 2000s, increased by only 1 million, while the non-institutionalized, working-age population grew by 22 million.
In keeping with my thesis that there is a point of diminishing return concerning immigration, I’m revisiting a dataset I compiled in 2011.
State Fiscal Health Ranking
State Fiscal Health Rank Correlated with Employed Foreign-born in the Labor Force
Highlight State for Ranking and Foreign-born Employment Levels
Fiscal Health Legend: _ Green = Best, _ Yellow = Median, _ Red = Poor
The 50 States and District of Columbia are ranked from 1st to 45th,
rankings do not total 51 because there are 12 ties
State Fiscal Ranking and Associated Avg. Immigrant Labor Force
- Top Quartile (top 75% fiscal ranked) = Immigrants employed in this labor force 4.7%
- Median (50% fiscal ranked) = Immigrants employed in this labor force 7.5%
- Lower Quartile (bottom 25% fiscal ranked) = Immigrants employed in this labor force 15.6%
Being composed of 50 states and the District of Columbia, we can rank the states based upon economic health and fiscal responsibly. Equally weighted data was used to create the state ranking, the data is composed of: housing foreclosure statistics, high school graduation rates, State budget shortfalls and an average of 22 months of state unemployment data. These statistics were chosen because:
- Immigrants compete with the native-born for available employment
- Immigrants compete with the native-born for available housing
- Immigrant concentric school districts are burdened with providing instruction in additional languages
- Some immigrants may be ineligible, but displaced native-born citizens are eligible for State social assistance programs
Correlating Immigration Data With State Rankings :
Once the ranking portion of the States was completed, 2007 Census data for, “Employed Foreign-born in the Labor Force” was correlated with each state fiscal rankings. As expected, the top fiscally performing States, have a demonstrable lower rate of foreign born employed in the labor force.
Great Recession: State Financial Health Data:
Data compiled on Dec. 21, 2011
- Foreclosures – number of foreclosures per X number of housing units (December 2010)
- H.S. Graduation – State graduation rates for the 2006-07 school year (latest available)
- State Budget Shortfall – 2010 budget shortfall data (by percent of state budget)
- Unemployment – A State average of 2010 and 2011 unemployment statistics to Sept. 2011
Foreign Born Employed in the Labor Force:
Immigration data is not a component of State State Fiscal Health Ranking,
only presented in comparison to fiscal ranking
- Employed Civilian Foreign-Born Labor Force by State: US Census 2007 Appendix Table A.
Table 1: Data is sorted by the State’s fiscal health ranking
| Data Used to Determine Fiscal Rank of Individual States (Data Sorted by Fiscal Ranking) |
Not included in ranking – comparison only | ||||
| Fifty States and District of Columbia | Foreclosure Rate: 1 Foreclosure per X units | High School Graduation Rate | State Overbudget: Total Gap as % of FY2010 Budget | Unemployment Rate: Average 2010-2011 | Foreign Born Employed in the Labor Force |
| Avg. States Above 50th Percentile | 2971 | 79.3% | 1.8% | 7.3% | 8.1% |
| Mean (50th Percentile) Hawaii | 513 | 75.4% | 2.5% | 6.4% | 20.6% |
| Avg. States Below 50th Percentile | 752 | 70.6% | 2.9% | 9.9% | 13.0% |
Table 1: In the States where the fiscal health is the group above the median we see:
- the occurrence of housing foreclosures in demonstrably lower
- the average High School Graduation Rate is 8.7% higher
- the average of State budget overruns are 1.1% lower
- the average Unemployment rate is 2.6% lower
- Foreign Born Employed in the Labor Force is 4.9% lower
Table 2: Data is sorted by the foreign born ranking
| Data Used to Determine Fiscal Rank of Individual States (Data Sorted by Foreign Born Ranking) |
Not included in ranking – comparison only | ||||
| Fifty States and District of Columbia | Foreclosure Rate: 1 Foreclosure per X units | High School Graduation Rate | State Overbudget: Total Gap as % of FY2010 Budget | Unemployment Rate: Average 2010-2011 | Foreign Born Employed in the Labor Force |
| Avg. States Above 50th Percentile | 2409 | 77.6% | 1.8% | 7.9% | 4.7% |
| Mean (50th Percentile) Minnesota | 817 | 86.5% | 2.3% | 7.1% | 7.5% |
| Avg. States Below 50th Percentile | 1302 | 71.9% | 2.9% | 9.3% | 17.0% |
Table 1: demonstrates that the States that are performing better than those in the lower Mean, also have consistently lower rates of Foreign Born Employed in the Labor Force. Table 1: and Table 2: demonstrate that States with lower averages of Foreign Born Employed in the Labor Force. On average, these States have better fiscal outcomes, lower foreclosure rates, lower unemployment rates and better high school graduation rates.
Table 2: When sorting the data by Foreign Born Employed in the Labor Force:
- the occurrence of housing foreclosures is demonstrably lower
- the average High School Graduation Rate is 5.5% higher
- the average of State budget overruns are again 1.1% lower
- the average Unemployment rate is 1.4% lower
- Foreign Born Employed in the Labor Force is 12.3% lower
State Ranking and Immigration Participation Table (sortable)
Source Data:State Budget Shortfalls:
Kaiser Family Foundation / statehealthfacts.org
http://www.statehealthfacts.org/comparemapreport.jsp?rep=49&cat=1
Unemployment Data by State:
Bureau of Labor Statistics
Local Area Unemployment Statistics (LAUS)
http://www.bls.gov/lau/
Data extracted on: December 20, 2011 (12:09:44 AM) Unadjusted data Jan. 2010 through Sept. 2011 (excludes preliminary data)
Foreign Born Employed in the Labor Force:
Appendix Table A.
Employed Civilian Foreign-Born Labor Force by State: 2007
www.census.gov/prod/2008pubs/acs-09.pdf
Foreclosure Rate:
Kaiser Family Foundation / statehealthfacts.org
Represents the number of foreclosures filed for every X housing units during the month of December 2010. A foreclosure is a legal procedure by which mortgaged property is sold, upon default, in order to satisfy a debt. Foreclosures generally are governed by state law, and rules may vary between states. http://www.statehealthfacts.org/comparetable.jsp?ind=649&cat=1
High School Graduation Rates:
SOURCE: U.S. Department of Education, National Center for Education Statistics, Common Core of Data (CCD), “State Nonfiscal Survey of Public Elementary/Secondary Education,” 1986-87 through 2007-08; The Averaged Freshman Graduation Rate for Public High Schools From the Common Core of Data: School Years 2002-03 and 2003-04; and Projections of Education Statistics to 2017. (This table was prepared September 2009.)
Updated on Feb 17, 2014, working age population grew by 22 million/ 25 million was entire population.
Source: http://immigration-weaver.blogspot.com/2014/02/did-we-learn-from-great-recession.html
