


Adoption of Software by a User Community: The Montage Image Mosaic Engine

This week’s post will be about building user communities, the topic of a paper I submitted for consideration for presentation at the Maintainable Software Practices in e-Science Workshop at the 8th IEEE International Conference on eScience 2012 in Chicago (Oct 8-12). My co-authors are Ewa Deelman, Gideon Juve and Mats Rynge.
The Montage mosaic engine continues to be adopted by the community in new ways, even though the last funded release was in 2006, and they are described in this paper. The Montage team has found that these are the best general practices for building a user community:
- Build software that meets specific scientific goals; don’t be a solution that looks for a problem.
- Listen to your user community, and if possible have a formal user-advisory group.
- Make sure the software is easy to build.
- Design for sustainability, extensibility, re-use and portability from the outset. Use modular or component-based designs.
- Be careful about new technologies; do a cost-benefit analysis before adopting them, and understand the risk if they become unsupported.
- Build a user community that encourages users to contribute to sustainability; take advantage of Web 2.0 in this endeavor.
- Use rigorous software engineering practices to ensure well-organized and well-documented code, and control and manage interfaces.
- Develop when possible in an open software, open data mode, where source code, a set of input data, and tests are freely available.
In the specific case of Montage, the combination of a component based architecture, portability across all common astronomy platforms, ease of installation and very fast image reprojections for the most common type of images has led to wide adoption by the astronomy and computer science communities. To date, there have been over 11,000 downloads of the Montage toolkit. The paragraphs below describe recent examples of adoption by the user community.
Access to the Montage functionality has been incorporated into the Astronomical Plotting Library in Python (APLpy; pronounced “apple pie”) package available from http://aplpy.github.com/. The package allows users to create publication-quality plots of astronomical imaging data, and it has been downloaded 600 times in the past five months. Montage is integral to the functionality of the package, and offers features such as creating an RGB cube that can be used to create three-color images and to align images with true north. Figure 1 shows an example of an image created with APLpy.

Fig. 1. The M16 nebula. An example of an RGB cube created with Montage running under the APLpy package. Image courtesy of Dr. Tom Robitaille.
Dr. Thomas Robitaille developed a Python Applications Programming Interface (API) to Montage, which supports calls to individual Montage modules and calls to functions that create mosaics. The API takes care of setting up the directories and cleaning up afterwards, so users only need to specify a directory containing the input files to mosaic and the output filename. This contributed software is in wide use in the astronomical community. Dr. Robitaille himself has used “python-Montage” to produce mosaics of infrared surveys of the Large and Small Magellanic Clouds made with Spitzer Space Telescope’s “Surveying the Agents of Galaxy Evolution” project. These mosaics are available as a public data product, and aggregate measurements in hundreds of thousands of individual data frames. Dr. Jean-Baptiste Marquette uses it to create images at different time intervals of fields studied by EROS-2, a microlensing survey. Still others use it to perform bulk processing and manipulation of images.
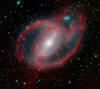
The Las Cumbres Observatory Global Telescope (LCOGT) has developed an extensive E/PO program that allows citizen scientists, educators and students to use the network of telescopes to perform their own investigations. Read about in Stuart Lowe’s blog. The program is using Montage to create three-color mosaics of images of regions of nebulosity, as illustrated in Figure 2. Broadly speaking, these investigations are intended to demonstrate how different colors can be used to study different chemical structures in star formation regions and supernova remnants.
 filter. The mosaic was composed as part of the LCOGT E/PO program. Image courtesy of Dr. Stuart Lowe.")
Fig. 2. A mosaic of the M42 nebula in Orion, in which images taken in the Hα filter are overlaid with images taken in the oxygen (OIII) filter. The mosaic was composed as part of the LCOGT E/PO program. Image courtesy of Dr. Stuart Lowe.
Of course, Montage continues to be used as a tool for scientific research. The following papers recently submitted cite Montage (see our paper for references):
- Detection of diffuse radio emission in the galaxy clusters A800, A910, A1550, and CL1446+26 .
- Comparing near-infrared extinction and submillimetre data in the molecular cloud TMC-1
- Integral Field Spectroscopy studies of 14 early-type galaxies in the Coma cluster
- The Dust Properties of Bubble HII Regions as seen by Herschel
I wish to thank Drs Tom Robitaille and Stuart Lowe for drawing my attention to material discussed here.

![]()
2012-08-05 23:00:06
Source:
