


| Story Views | |
| Now: | |
| Last Hour: | |
| Last 24 Hours: | |
| Total: | |
2012 Antarctic Ozone Hole Second Smallest in 20 Years

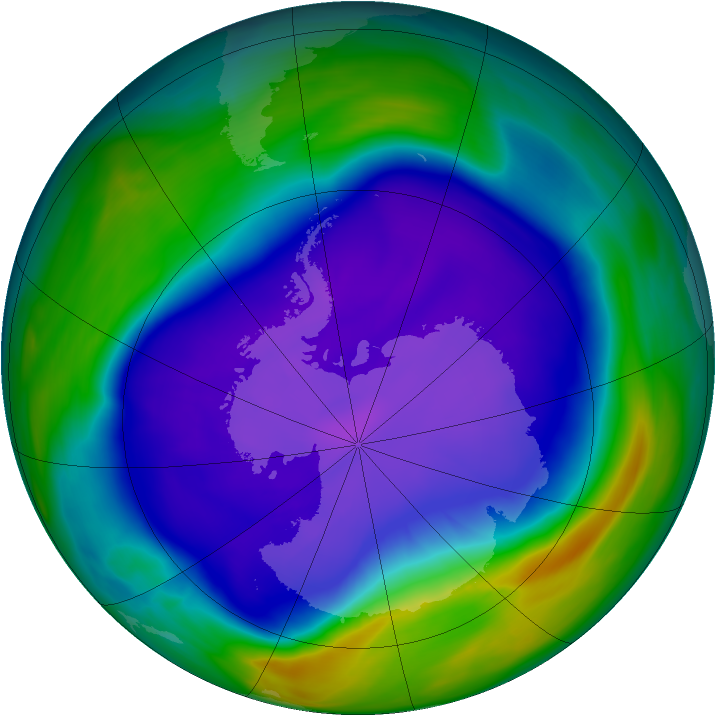
The ozone hole reached its maximum size Sept. 22, covering 8.2 million square miles (21.2 million square kilometers), or the area of the United States, Canada and Mexico combined. The average size of the 2012 ozone hole was 6.9 million square miles (17.9 million square kilometers). The Sept. 6, 2000 ozone hole was the largest on record at 11.5 million square miles (29.9 million square kilometers).
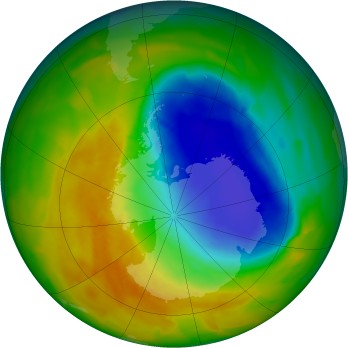
“The ozone hole mainly is caused by chlorine from human-produced chemicals, and these chlorine levels are still sizable in the Antarctic stratosphere,” said NASA atmospheric scientist Paul Newman of NASA’s Goddard Space Flight Center in Greenbelt, Md. “Natural fluctuations in weather patterns resulted in warmer stratospheric temperatures this year. These temperatures led to a smaller ozone hole.”
The ozone layer acts as Earth’s natural shield against ultraviolet radiation, which can cause skin cancer. The ozone hole phenomenon began making a yearly appearance in the early 1980s. The Antarctic ozone layer likely will not return to its early 1980s state until about 2065, Newman said. The lengthy recovery is because of the long lifetimes of ozone-depleting substances in the atmosphere. Overall atmospheric ozone no longer is declining as concentrations of ozone-depleting substances decrease. The decrease is the result of an international agreement regulating the production of certain chemicals.
This year also showed a change in the concentration of ozone over the Antarctic. The minimum value of total ozone in the ozone hole was the second highest level in two decades. Total ozone, measured in Dobson units (DU), reached 124 DU on Oct. 1. NOAA ground-based measurements at the South Pole recorded 136 DU on Oct. 5. When the ozone hole is not present, total ozone typically ranges from 240-500 DU.
This is the first year growth of the ozone hole has been observed by an ozone-monitoring instrument on the Suomi National Polar-orbiting Partnership (NPP) satellite. The instrument, called the Ozone Mapping Profiler Suite (OMPS), is based on previous instruments, such as the Total Ozone Mapping Spectrometer (TOMS) and the Solar Backscatter Ultraviolet instrument (SBUV/2), which have flown on multiple satellites. OMPS continues a satellite record dating back to the early 1970s.
“OMPS Limb looks sideways, and it can measure ozone as a function of height,” said Pawan K. Bhartia, a NASA atmospheric physicist and OMPS Limb instrument lead. “This OMPS instrument allows us to more closely see the vertical development of Antarctic ozone depletion in the lower stratosphere where the ozone hole occurs.”
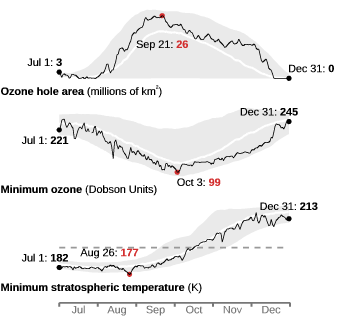
The data for the ozone hole area, the minimum ozone, and the minimum stratospheric temperature are available. Also available is a table of values showing the maximum ozone hole area and the minimum ozone values for each year
The graphs above show the variations of ozone from year to year. The red bars indicate the largest area and the lowest minimum value. The year-to-year fluctuations are superimposed on a trend extending over the last three decades.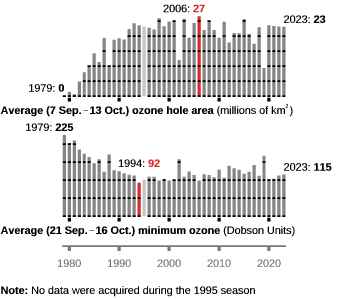
NASA and NOAA have a mandate under the Clean Air Act to monitor ozone-depleting gases and stratospheric depletion of ozone. NOAA complies with this mandate by monitoring ozone via ground and satellite measurements. The NOAA Earth System Research Laboratory in Boulder, Colo., performs the ground-based monitoring. The Climate Prediction Center performs the satellite monitoring.
To monitor the state of the ozone layer above Antarctica, visit: http://ozonewatch.gsfc.nasa.gov
2012-10-24 22:01:18
Source: http://nanopatentsandinnovations.blogspot.com/2012/10/2012-antarctic-ozone-hole-second.html
Source:
