


Astroinformatics 2013 – Day Two Morning, December 10

Day Two of Astroinformatics 2013, hosted by CSIRO, where we are discussing advances in data processing, manipulation and management – crucial topics in modern astronomy. You can see the agenda here, along with a growing list of presentations, and you can follow on Twitter with the hashtag #astroinfo. Day Two is being broadcast on YouTube at
http://www.youtube.com/watch?v=scLmtRgte3g
This morning’s session was on the topic “Trends in Computing.” George Djorgovski kicked off with “The fourth paradigm in Astrophysics.” He emphasized not just the scale of modern data but their complexity, and the implication that we need to analyze parameter space systematically to extract their science content. This multi-dimensional approach requires the use of efficient and sophisticated algorithms to drive discovery. Visualizing complexity is a particularly difficult task.
Andy Green spoke on “How to Work Together on Software.” He emphasized the value of a rigorous development process, with version control, and a well-thought through test and validation plan. All projects should adopt practices such as these.
Ninan Sajeeth Philip described “Learning from Partial Information,” using case studies from the Sloan Digital Sky Survey as examples.
After coffee, we had presentations on visualization. Chris Fluke described “Big data visualisation and analysis challenges,” including a live demo, so be sure to watch the YouTube feed. The overarching question is how to enable real-time, interactive visualization of large, complex data sets, especially data cubes. He used the WALLABY HI survey as a case study: It produces 1TB cubes, 1200 in all. And yeas, they can be visualized in real time, using GPU nodes on the Australian gStar facility to drive the processing – but you have to port your visualization code to work on GPU’s.
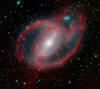
Claudio Gheller described how to use Splotch, a portable C++ based ray-tracing program, to support high performance visualization of astrophysical data. He used cosmological N-body simulations as a case study, with GPU’s used to perform the crunching. He also showed a simulation, so again, be sure to watch the video. Finally, Baerbel Koribalski spoke about “3D Visualisation of Gas and Stars in Galaxies.” She described how she used Splotch to visualize not simulations, but HI data from the WALLABY. Check out the Pink Floyd soundtrack to the video demonstration.

![]()
Source: http://astrocompute.wordpress.com/2013/12/09/astroinformatics-2013-day-two-morning-december-10/
