


| Story Views | |
| Now: | |
| Last Hour: | |
| Last 24 Hours: | |
| Total: | |
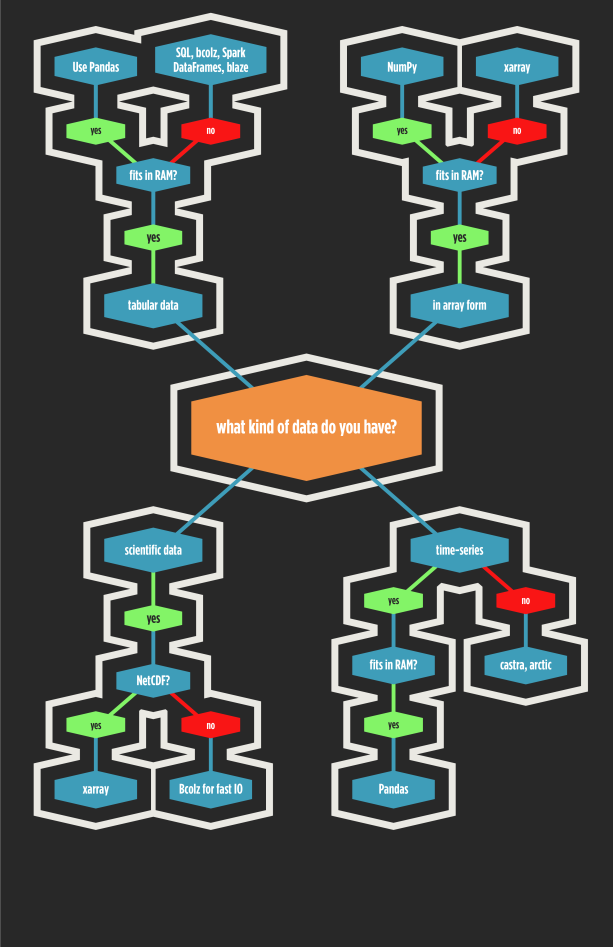
A map of the PyData Stack
Wednesday, March 2, 2016 13:28
% of readers think this story is Fact. Add your two cents.

One question you have when you use Python is what do I do with my data. How do I process it and analyze it. The aim of this flow chart is to simply provide a simple to use ‘map’ of the PyData stack.
At PyData Amsterdam I’ll present this and explain it in more detail but I hope this helps.
Copyright 2016 Peadar Coyle

![]()
Source: https://peadarcoyle.wordpress.com/2016/03/02/a-map-of-the-pydata-stack/
