


| Story Views | |
| Now: | |
| Last Hour: | |
| Last 24 Hours: | |
| Total: | |
Geek Out! How to Build Your Own Nova Delphini Light Curve


Nova Delphini (center) continues to shine brightly enough to see in binoculars and with the naked eye once the moon’s out of the sky. While we still don’t know its distance, novae like this one are typically between 1,000 to 1,500 light years away. Credit: John Chumack
And now for something to appeal to your inner geek. Or, if you’re like me, your outer geek. Many of you have been watching the new nova in Delphinus with the naked eye and binoculars since it burst onto the scene early Aug. 14. In a moment I’ll show how to turn your observations into a cool representation of the nova’s behavior over time.
Updated Nova Delphini 2013 chart using the latest visual magnitudes from the AAVSO showing stars around the nova to magnitude 7.1. Click for larger version. Stellarium
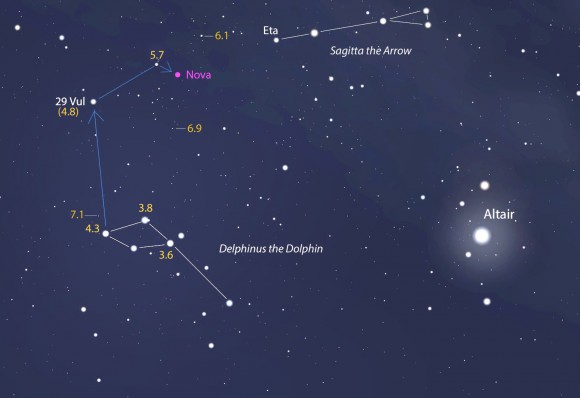
Where I live in northern Minnesota, we’ve had a lucky run of clear nights since the outburst began. Each night I’ve gone out with my 8×40 binoculars and star chart to estimate the nova’s brightness. The procedure is easy and straightforward. You find comparison stars near the nova with known magnitudes, then select one a little brighter and one a little fainter and interpolate between the two to arrive at the nova’s magnitude.
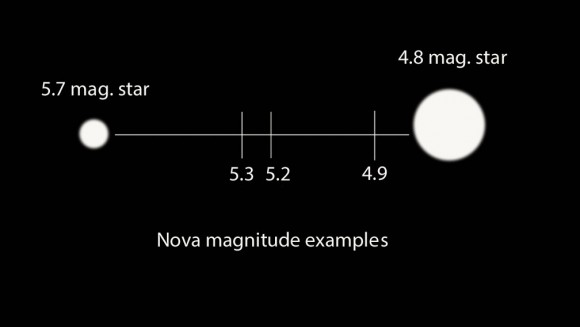
Estimating a star’s magnitude by creating a sliding scale in your mind’s eye between stars that bracket the nova in brightness. Illustration: Bob King
For example, if the nova’s brightness lies halfway between the magnitude 4.8 and 5.7 stars it’s about magnitude 5.3. The next night you might notice it’s not exactly halfway but a tad brighter or closer to the 4.8 star. Then you’d measure 5.2. Remember that the smaller the number, the brighter the object. I’ve found that defocusing the stars into disks makes it a bit easier to estimate these differences.
In time, you’ll come up with a list of magnitudes or brightness estimates for Nova Delphini. Here’s mine to date:
* Aug. 14: 5.8
* Aug. 15: 4.9
* Aug. 16: 5.0
* Aug. 17: 5.0
* Aug. 18: 5.0
* Aug. 19: 5.2
* Aug. 20: 5.5
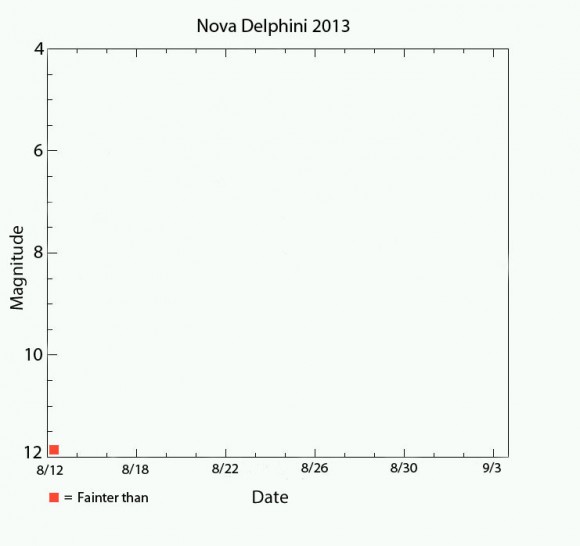
Template you can use to plot your own estimates of Nova Delphini 2013′s night by night brightness through Sept. 3. Click for larger version.
So far just numbers, but there’s a way to turn this into a satisfying visual picture of the nova’s long-term behavior. Graph it! That’s what astronomers do, and they call it a light curve.
I dug around and came up with this very basic template. The horizontal or x-axis measures time in days, the vertical or y-axis plots the nova’s brightness measured in magnitudes. You can either right-click and save the image above or grab the higher-res version HERE.

I plotted my own brightness estimates of the nova using Photoshop Elements. You can do it on computer or with paper and pencil.
Next, print out a copy and lay in your data points with pencil and ruler the old-fashioned way or use an imaging program like Photoshop or Paint to do the same on the computer. I use a very basic version of Photoshop Elements to plot my observations. Once your observations are marked, connect them to build your light curve.
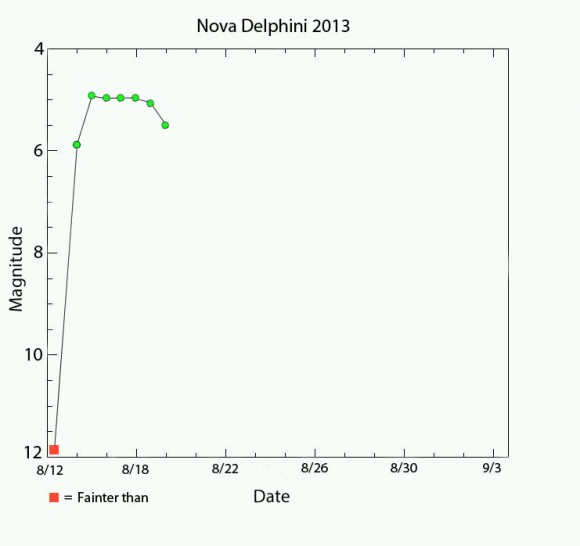
Connecting the dots, we can start to see how the nova behaves over time. The sudden jump from obscurity as well as the brief plateau before fading are obvious.
Right away you’ll notice a few interesting things. The nova shot up from approximately 17th magnitude on Aug. 13 to 6.8 on Aug. 14 – a leap of more than 10 magnitudes, which translates to a nearly 10,000 fold increase in brightness.
I wasn’t able to see the Nova Del top out at around 4.4 magnitude – that happened when I was asleep the next morning – but I did catch it at 4.9. The next few days the nova hits a plateau followed by what appears for the moment like a steady decline in brightness. Will it rocket back up or continue to fade? That’s for you and your binoculars to find out the next clear night.
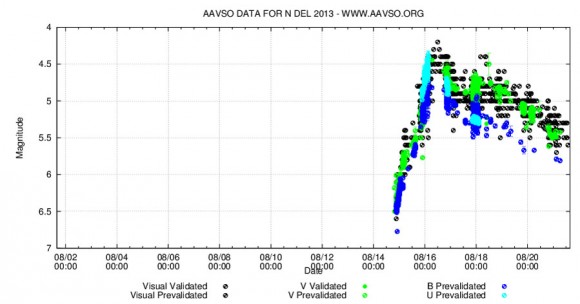
AAVSO light curve to date for Nova Delphini 2013 created using their light curve generator. The plot includes observations from many observers. Copyright: AAVSO
If you’d like to take the next step and contribute your observations for scientific use, head over to the AAVSO (American Assn. of Variable Star Observers) and become a member. Even if you don’t sign up, access to data, charts and light curves of novae and other variable stars is completely free.
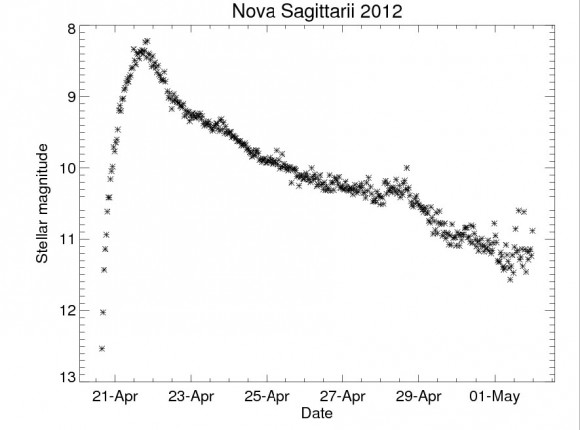
Nova Sagittarii 2012 light curve. Notice the occasional plateaus as well as bumps in brightness as it faded back to minimum light. Credit: NASA
I get a kick out of comparing my basic light curves with those created with thousands of observations contributed by hundreds of observers. The basic AAVSO curve looks all scrunched up for the moment because their time scale (x-axis) is much longer term than in my simple example. But guess what? You can change the scale using their light curve generator and open up the view a little more as I did in the curve above.
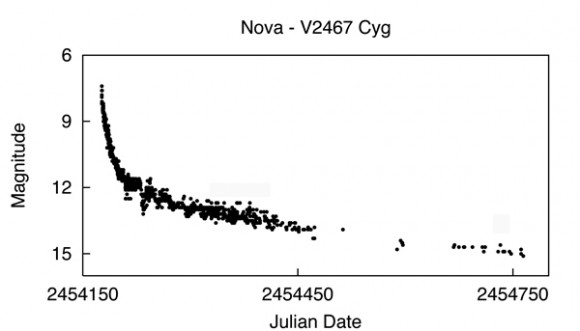
Light curve of V2467 Cygni, a nova that appeared in Cygnus in 2007. Credit: AAVSO
Here are a couple other typical novae light curves. By the time you’re done looking at the examples here as well as creating your own, you’ll gain a familiarity that may surprise you. Not only will be able to interpret trends in Nova Delphini’s brightness, but you’ll better understand the behavior of other variable stars at a glance. It’s as easy as connecting the dots.
© Bob King for Universe Today, 2013. |
Permalink |
No comment |
Post tags: AAVSO, light curve, magnitude, Nova Delphini 2013
Feed enhanced by Better Feed from Ozh
Source: http://www.universetoday.com/104266/geek-out-build-your-own-nova-delphini-light-curve/
