

| Online: | |
| Visits: | |
| Stories: |

| Story Views | |
| Now: | |
| Last Hour: | |
| Last 24 Hours: | |
| Total: | |
Critical Alert — Is This Really the Last Hurrah For the Market? More Evidence of an Imminent Stock Market Crash! (Video)


CRITICAL ALERT: More Evidence Of Imminent Stock Market Crash
3 Sep 15
Another important update for you fine folks. Stay at the ready!
The Stock Market: Is This Really The Last Hurrah?
Gregory Mannarino, TradersChoice.net
Truth be told I could literally go blind looking at charts, it is a language foreign to most which greatly rewards those who respect the story they tell.
There is also an old Wall Street saying which goes like this: “you trade the market you have, not the one you want.”
The truth is this, the markets are alive. The price movement of any and all markets involve the conscious thought of each participant, even those trades done by machines. Because auto-trading platforms as well were programmed by a human being.
So every chart tells a collective story.
It is certainly no secret that these markets, especially the stock market, is “behaving” in a manner which has raised more than a few eyebrows as of late. In fact every day people walking the street are even taking notice.
Is a big story about to be told? And what do the charts say?
Let’s have a look.
The following is a chart segment of the Dow Jones Industrial Average dating from when the Federal Reserve first began quantitative easing, after the last stock market crash. So the story being told by the following chart really begins in 2009.
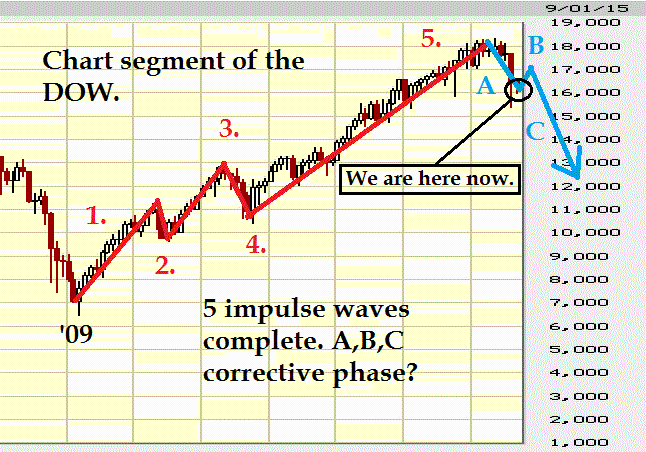
For those of you not familiar with the Elliot Wave Principal, this is a theory which states that markets follow certain patterns based upon “collective investor psychology.” These waves move between optimism and pessimism, as a result, these cycles can be seen as a series of impulse waves, five of them as numbered on the chart. These five waves are followed by “corrective waves,” three of them, also seen on the chart marked A,B,and C.
While not fact, I believe that this “theory” has merit.
Having another look at the chart above, it appears that we may just have completed the first corrective wave, A. If this plays out as I believe it may, we have just entered the next wave, B, a move higher, which will then be followed by wave C, and a large downward move.
In truth all of this is playing out exactly the way it should as of late with regard to the current price action of these markets. Moreover, it is validating the Elliot Wave Sequence.
The real question is this: what is the probability that we will soon be facing massive and sustained losses in this market? I.E. a C wave? I believe that in recent history we have not seen higher chances of this occurring.
I recently wrote an article here on Seeking Alpha titled: “Run! Don’t Walk, Away From The US Stock Market. Here Is Why.” The premise of that article plays right into this Elliot Wave Theory.
Moreover, since “The DOW Is Now Down 2000 Points Since I Called The Top Back In May,” I believe this theory is more than valid at this time.

#prophecy #finance #stockmarket #deathofthedollar
