


| Story Views | |
| Now: | |
| Last Hour: | |
| Last 24 Hours: | |
| Total: | |
France is Stuck in the Mud

by Rebecca Wilder
According to the Eurostat flash estimate, Euro area GDP fell by 0.2% in both the euro area and the EU27 in the second quarter of 2012. In the first quarter of 2012, growth rates were 0.0% in both zones. On balance, the Euro area is very likely in recession despite the fact that the region successfully skirted the “two negative quarters of growth” rule of recession dating having stagnated in Q1 2012 following a 0.3% contraction in Q4 2011.
The underlying country GDP estimates for Q2, released by the various statistical agencies, do illustrate a deep divide among the growth prospects across the 17-country Euro area in Q2 2012. Here is a select list of reported growth results (all for Q2 2012 in % Q/Q not annualized):
Germany, +0.3%
France , +0.0%
Netherlands, +0.2%
Spain, -0.4%
Italy, -0.7%
Portugal, -1.2%
The French flash release, in particular, caught my eye: “No growth for the third consecutive quarter” is what INSEE titled its publication. The French economy has effectively stalled. Using Eurostat data, the economy has grown just 0.09% (the unrevised numbers) since July 2011. And since Q2 2011, the economy grew just 0.3%. In all, the economy is not technically in recession but it certainly isn’t expanding. To me, the question is, will it go up or down from here?
Compared to history, the current expansion in France has been nothing short of pathetic. Stuck in the mud.
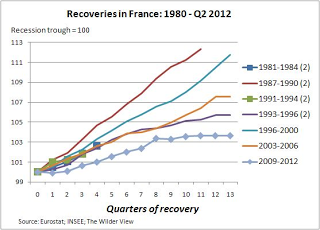
Note: In the chart above, the French dating of business cycles is taken from the OECD, which is available through the FRED database. In the legend, those dates with a (2) indicate short recoveries with an ensuing recession (1 recession and 1 expansion with the same number of quarters as the 2009-2012 expansion). Therefore, the graphs are truncated when the next recession started over the period.
Rebecca Wilder

2012-08-15 08:19:00
Source: http://www.angrybearblog.com/2012/08/france-is-stuck-in-mud.html
Source:
