
| Visitors Now: | |
| Total Visits: | |
| Total Stories: |

| Story Views | |
| Now: | |
| Last Hour: | |
| Last 24 Hours: | |
| Total: | |
Citigroup Flash-Crashes In 100 Miliseconds To The Tune Of $1 Billion
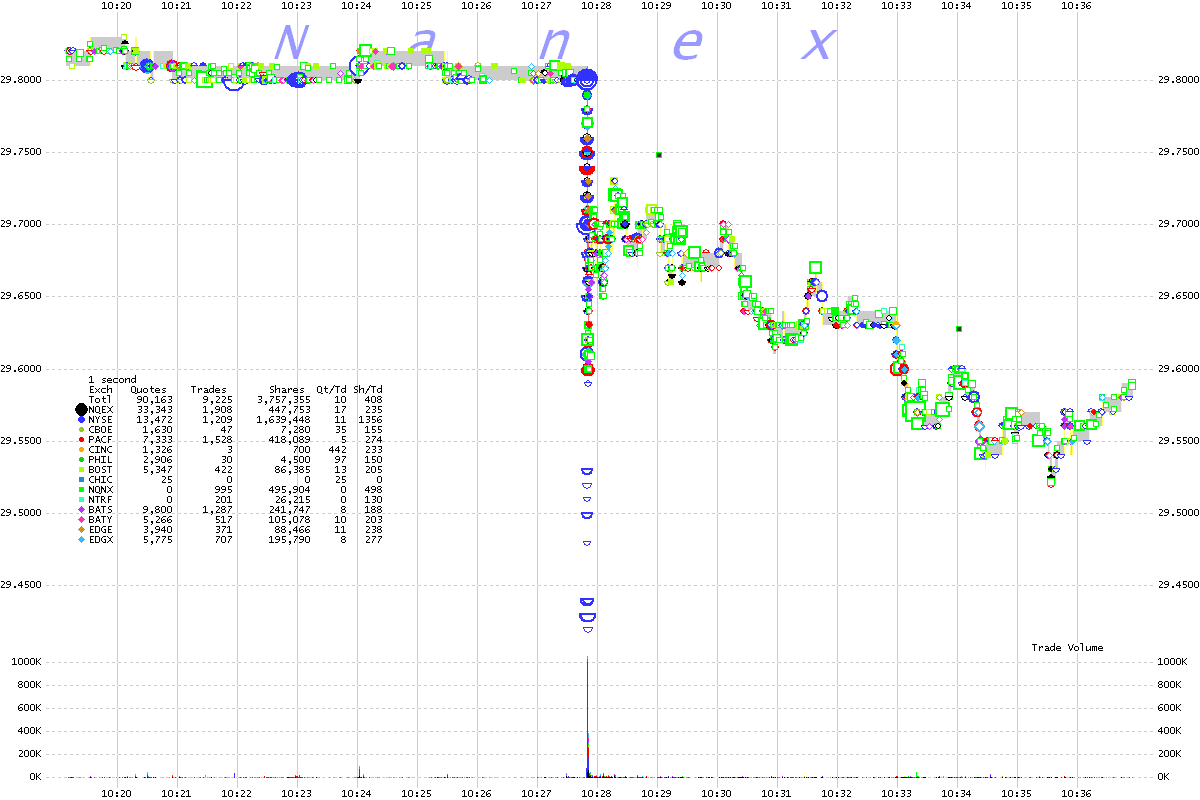
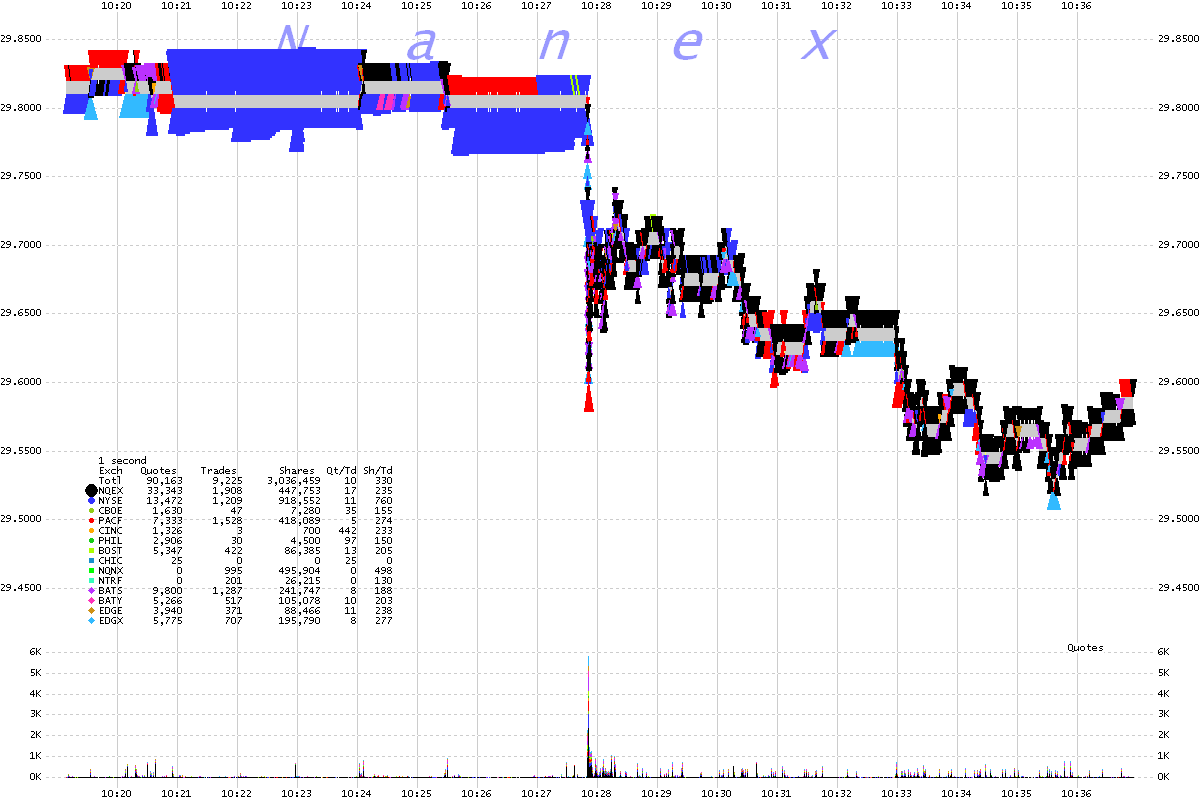
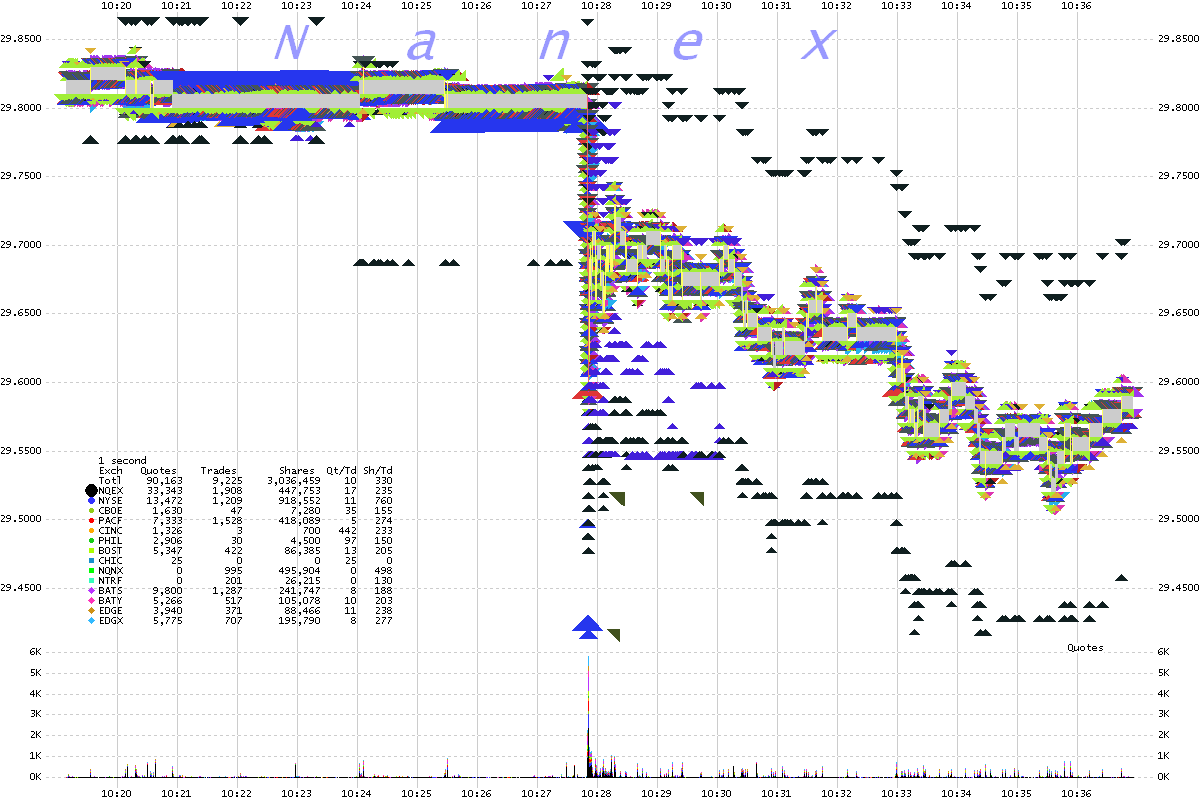
It’s quiet out there; too quiet. But if you were watching carefully this morning, everyone’s favorite government-subsidized bank - Citigroup – flash-crashed to the tune of a $1.2bn market-cap loss in a fraction under 100 milliseconds. A 1.3% micro-crash on absolutely massive volume so perfectly visualized thanks to Nanex. When does this ‘liquidity-providing’ fiasco stop?
August 27, 2012 at 10:27:50.900 Citigroup (symbol C) dropped 1.3% (from 29.80 to 29.42) in about 100 milliseconds.
1. One second interval chart showing trades color coded by exchange.

2. One second interval chart showing best bids and offers color coded by exchange.

3. One second interval chart showing all bids and offers color coded by exchange.

Read more here: http://www.zerohedge.com/news/when-it-all-goes-bidless-what-losing-1-billion-100-milliseconds-looks


