


| Story Views | |
| Now: | |
| Last Hour: | |
| Last 24 Hours: | |
| Total: | |
Which Obama Policy Killed the Recovery?

Not long ago, we used stock market-style technical analysis to reveal that the policies implemented during President George W. Bush’s tenure in office were most likely responsible for launching the economic recovery that followed the December 2007 recession and that the policies implemented during President Barack H. Obama’s tenure in office were most likely responsible for derailing that recovery.
Since technical analysis is such a weak analytical technique, we thought we’d revisit that topic today using a combination of regression analysis and statistical analysis, focusing in on the one data metric that really defines a recession for most people: job layoffs.
Our chart below uses the Bureau of Labor Statistics’ data for the seasonally-adjusted number of initial unemployment insurance benefit claims filed each week for the period spanning 6 July 2008 through 26 September 2010, which tracks the number of job layoffs that occurred during this period. We’ve annotated the chart to show the major events that coincided with major shifts in the trend in job layoffs or that affected the trend in data for short periods of time.
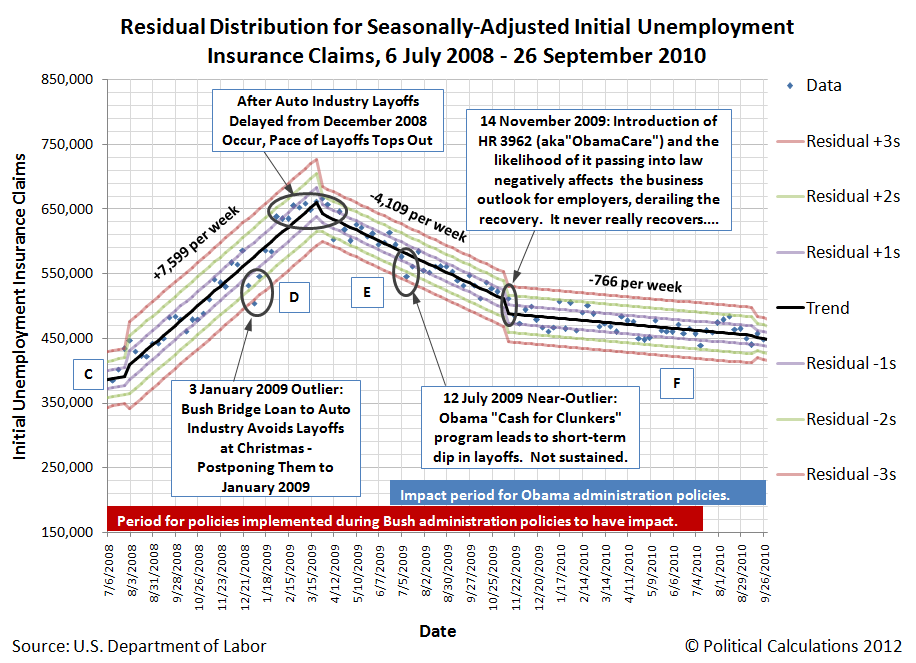
In the chart above, we’ve also indicated Mark Thoma’s “effectiveness lag“, which represents the typical amount of time from when federal government policies are implemented to when they have a noticeable impact, which he indicates is 6 to 18 months long. We note that economists have long recognized this real world phenomenon and that its existence is widely accepted (except perhaps by philosophy professors who would seem to care more about credentials than thought.)
Here, the chart shows that the rate of layoffs in the U.S. was increasing at an average rate of 7.599 per week from August 2008 up until they peaked in March 2009. Along the way, we note an unusual outlier where the number of layoffs plunged in late December-early January, which corresponds to the emergency bridge loan that the Bush administration extended to failing companies in the auto industry to avoid massive layoffs during the Christmas and New Year’s holidays in the U.S.
Those massive layoffs were only postponed however to the period from mid-January 2009 through February 2009, as the number of weekly layoffs in the U.S. stopped rising and topped out at this time. Without the Bush administration bridge loan to the auto industry, we note that the peak in layoffs during the recession would have occurred earlier.
After topping out, the pace of layoffs began to fall at a rate of 4,109 per week, which held up through mid-November 2009. There is one near-outlier recorded during this period, which coincides with the Obama administration’s “Cash for Clunkers” program, which temporarily saw the number of weekly layoffs fall while it ran. And then, because the program could no longer be sustained, the rate of layoffs in the U.S. resumed the path they had previously been on.
All that changed after 29 November 2009 however, which President Obama’s signature achievement of his administration, the bill that the Patient Protection and Affordable Care Act (aka “ObamaCare”) was introduced in the House of Representatives as H.R. 3962. The introduction of this bill, the result of the Democratic Party’s supermajority in the U.S. Congress which meant it was likely to pass, and the uncertainty it unleashed for employers combined with the higher costs it mandated for them, derailed the economic recovery. We observe that derailment in the sudden deceleration of the pace of recovery as the number of layoffs in the U.S. each week dropped from falling at an average rate of 4,109 per week to just 766 per week all the way through 19 September 2010.
And that, in a nutshell, is what President Obama did to kill off the strong economic recovery President Obama inherited and replaced it with the weak jobs recovery that has dominated ever since. The major trends in U.S. layoffs through all this period is described here, which explains the letters shown on the chart above!
2012-10-05 23:07:49
Source: http://politicalcalculations.blogspot.com/2012/10/which-obama-policy-killed-recovery.html
Source:
