


| Story Views | |
| Now: | |
| Last Hour: | |
| Last 24 Hours: | |
| Total: | |
As the Housing Bubble Inflates: Month 9

Yesterday was all abuzz as the just-released Case-Shiller index for March 2013 revealed that home prices in the U.S. had increased by 10.9 percent from their March 2012 level.
That, of course, is nearly two-month old news. Our first chart jumps a month forward in time to see where things stand through April 2013:
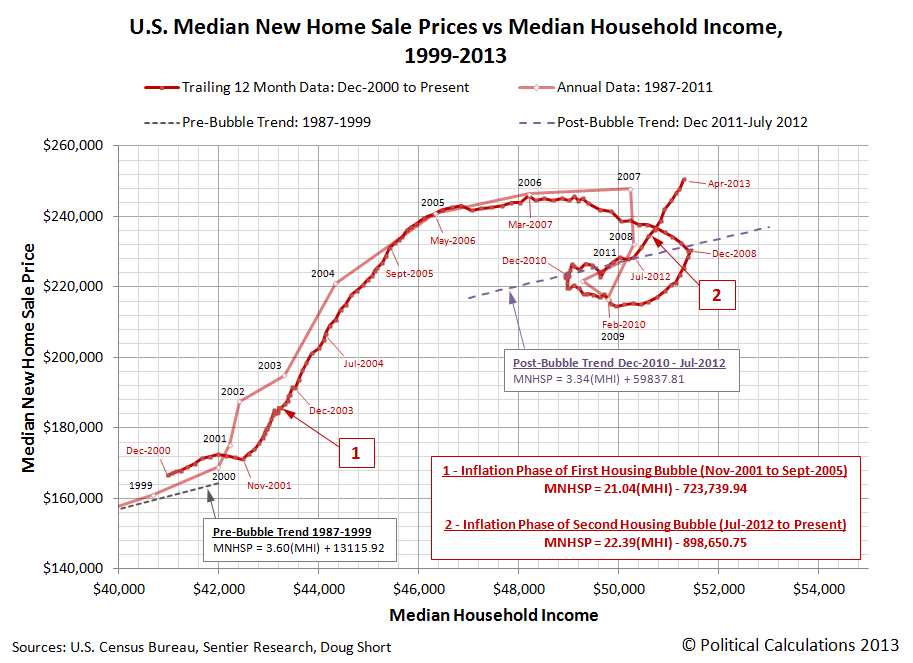
Here, the U.S. Census Bureau reports that median new home sale prices in the U.S. reached a preliminary record value of $271,600 in April 2013, with the 12-month trailing average of median new home sale prices reaching a preliminary record value of $250,633. We say these values are preliminary since they will be revised as additional data is recorded in the next several months. The recent trend has been for the data to be revised upward.
Meanwhile, Sentier Research indicates that median household income has reached a value of $51,546 in April 2013, up from the $51,320 that they previously reported for March 2013. Here, the 12-month trailing average of median household income in the U.S. is $51,301.
In the nine months since the second U.S. housing bubble began to inflate in July 2012, the median sale price of new homes in the United States has increased at an average rate of well over $22 for each $1 increase in median household income. The only period of time in modern American history that had a similar rate of price escalation was the original inflation phase of the first U.S. housing bubble.
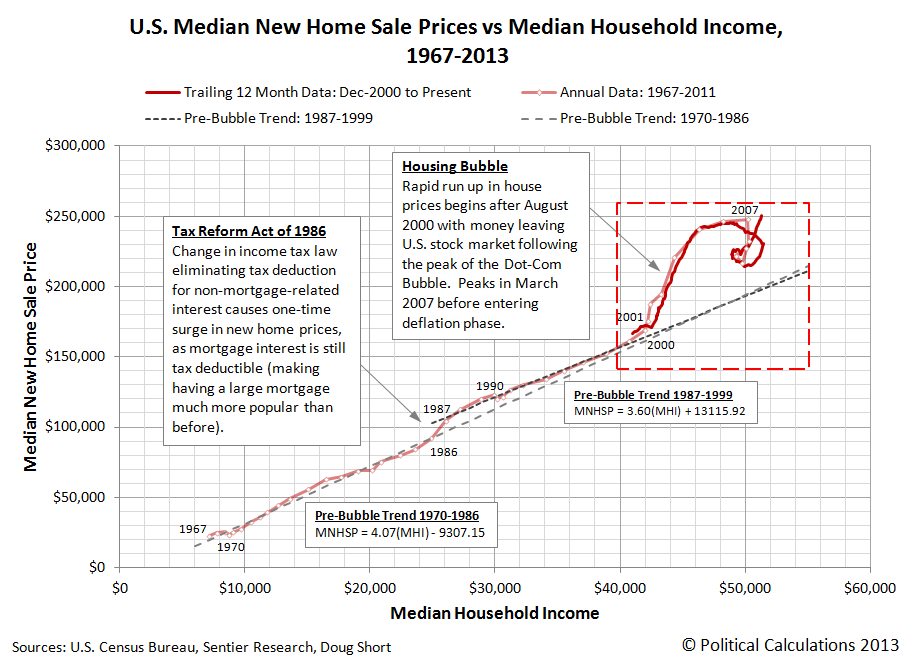
Our second chart shows more of that history. The red-dashed line box in the upper right hand corner is detailed in our first chart:
Meanwhile, the staff of the Wall Street Journal is resisting the mere idea that a new bubble has begun to inflate in the U.S. housing market:
Recent increases in home prices have already ignited new talk of a housing bubble. Don’t believe it.
Some regions are seeing a surge of housing demand amid extremely low interest rates and investors searching for opportunities. And it is true that some regions are up more than 25% from their bottom. But as Dan Greenhaus of BTIG LLC points out, none of the 20 cities tracked by the Standard & Poor’s Case-Shiller home-price indexes is back to its peak level. < ?p>
“Those previous peaks may not have been justified but they were and are largely seen as ‘bubble levels,’” said Mr. Greenhaus. “Can home prices again be in a bubble and yet be 27% below their previous peak? Perhaps, but we don’t yet think so.”
The median new home sales price data begs to differ, although the WSJ staff has suggested an alternative explanation for why they are ratcheting up so quickly.
Still, we find this line of thinking to be interesting, in that it indicates that they really believe that the greatly inflated prices of homes during the first U.S. housing bubble were really reasonable and that they could be supported indefinitely on the household incomes of U.S. homebuyers, if not for their bad luck!
From that perspective, it’s just unfortunate that today’s median new home sale prices are growing so much more quickly than the median household incomes earned by the kind of Americans who might want to buy and live in them.
Previously on Political Calculations
Our ongoing analysis of the development of the second U.S. housing bubble, presented in chronological order below!
- The U.S. Housing Bubble Is Back – we apply our groundbreaking analytical methods to determine that a new housing bubble has begun to inflate in the U.S. economy.
- Fuel, Oxidizer and a Spark – Part 1 – we revisit the origins of the first U.S. housing bubble and identify the factors that ignited it.
- Fuel, Oxidizer and a Spark – Part 2 – we explain why housing prices rose so much more in just four states than they did elsewhere.
- Fuel, Oxidizer and a Spark – Part 3 – we examine the factors that kept the first U.S. housing bubble going, even after the Fed acted to stop throwing so much fuel on the fire.
- Confirming the Second U.S. Housing Bubble – using revised data, we confirm that there is no apparent new-year slowdown in the inflation phase of the new U.S. housing bubble.
- The Second U.S. Housing Bubble Continues to Inflate – we extend our bubble analysis through March 2013!
- As the Housing Bubble Inflates: Month 9 – we mark the ninth month of the second U.S. housing bubble’s existence!
Source: http://politicalcalculations.blogspot.com/2013/05/as-housing-bubble-inflates-month-9.html
